
Unsupervised learning algorithms#
Unsupervised learning is a type of algorithm that learns patterns from untagged data. The hope is that through mimicry, which is an important mode of learning in people, the machine is forced to build a compact internal representation of its world and then generate imaginative content from it.
These notebooks serve us to practice some ML techniques, and as snippets to build on.
Visualisation of clustering#
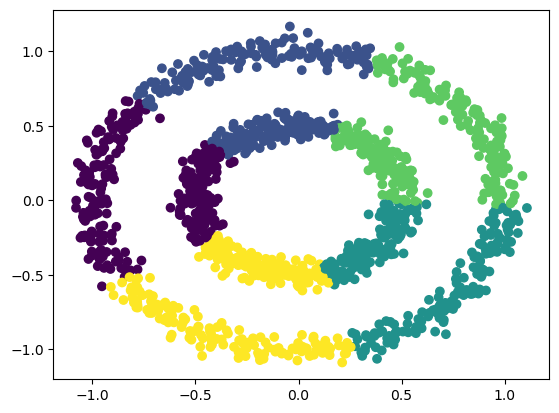
KMeans clustering#
Based on the number of clusters defined by the user, centroids are generated either by setting initial estimates or by randomly choosing them from the data points.
All the data points are assigned to the nearest cluster in the data space by measuring their respective distances from the centroid. The objective is to minimize the squared Euclidean distance,
Centroids are recalculated by computing the mean of all the data points belonging to a cluster.
The last two steps are repeated in an iterative process until a criterion is met (The number of iterations defined | The data points do not change from cluster to cluster | The Euclidean distance is minimized)
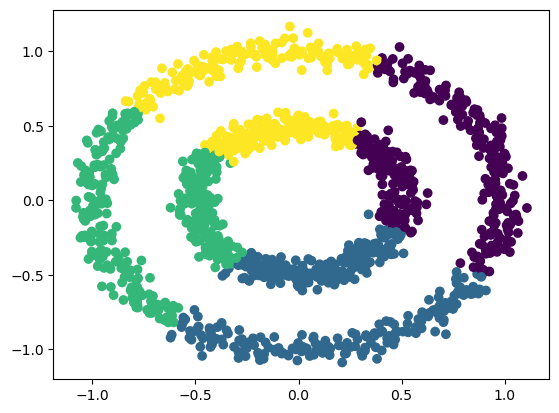
MeanShift clustering#
The data points are represented as a density distribution using Kernel Density Estimation (KDE). The peaks (high-density areas) will be the clusters. A window of a specified size (bandwidth) is drawn around each data point.
The mean of the data inside the window is computed.
The center of the window is shifted to the mean.
The last two steps are repeated until the data point reaches a peak, which will determine the cluster that it belongs to.
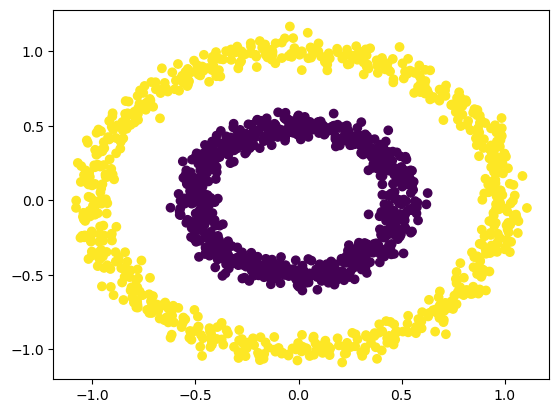
DBSCAN clustering#
Epsilon (eps) is the maximum distance that defines the radius within which the algorithm searches for neighbors. The minimum number of observations, on the other hand, refers to the number of data points required to form a high-density area (min_samples).
Metrics#
The Silhouette Coefficient Score calculates the mean distance between each point and all the other points of a cluster (a), as well as the mean distance between each point and all the other points of its nearest clusters (b).
The result of the score is a value between -1 and 1. The lower the value, the worse the performance of the algorithm. Values around 0 will imply overlapping of clusters.
Algorithm |
Silhouette Coefficient Score |
|---|---|
KMeans |
0.35944240125748783 |
MeanShift |
0.3705351315933256 |
DBSCAN |
0.11394082711912518 |
This score does not work very well when using density-based algorithms such as DBSCAN.
Calinski–Harabasz Index#
The Calinski–Harabasz Index measures the relationship between the variance of each cluster and the variance of all clusters. The variance of each cluster is the mean square error of each point with respect to the centroid of that cluster. The variance of all clusters refers to the overall inter-cluster variance.
The higher the value of the Calinski–Harabasz Index, the better the definition and separation of the clusters. There is no acceptable cut-off value, and the performance of the algorithms using this index is evaluated through comparison, where the algorithm with the highest value is the one that performs best.
Algorithm |
Calinski–Harabasz Index |
|---|---|
KMeans |
1379.6867334360659 |
MeanShift |
1305.1425653034062 |
DBSCAN |
0.0017164732936172393 |
As with the Silhouette Coefficient, this score does not perform well on density-based algorithms such as DBSCAN.
Conclusion#
The scikit-learn library does not contain other methods for effectively measuring the performance of density-based clustering algorithms. Silhouette and Calinski–Harabasz may work in some cases (MeanShift) to measure performance, but when they do not, there is no other way to measure this other than by using manual evaluation.