
Restaurant performance#
Introducing a No Smoking Day for the terrace (on request). Which day would be best?
Importing libraries and packages#
 1# Mathematical operations and data manipulation
 2import numpy as np
 3
 4# Plotting
 5import matplotlib.pyplot as plt
 6import seaborn as sns
 7
 8# Warnings
 9import warnings
10
11warnings.filterwarnings("ignore")
12
13%matplotlib inline
Set paths#
1# Path to datasets directory
2data_path = "./datasets"
3# Path to assets directory (for saving results to)
4assets_path = "./assets"
Loading dataset#
1dataset = sns.load_dataset("tips")
Exploring dataset#
1# Shape of the dataset
2print("Shape of the dataset: ", dataset.shape)
3# Head
4dataset
Shape of the dataset: (244, 7)
| total_bill | tip | sex | smoker | day | time | size | |
|---|---|---|---|---|---|---|---|
| 0 | 16.99 | 1.01 | Female | No | Sun | Dinner | 2 |
| 1 | 10.34 | 1.66 | Male | No | Sun | Dinner | 3 |
| 2 | 21.01 | 3.50 | Male | No | Sun | Dinner | 3 |
| 3 | 23.68 | 3.31 | Male | No | Sun | Dinner | 2 |
| 4 | 24.59 | 3.61 | Female | No | Sun | Dinner | 4 |
| ... | ... | ... | ... | ... | ... | ... | ... |
| 239 | 29.03 | 5.92 | Male | No | Sat | Dinner | 3 |
| 240 | 27.18 | 2.00 | Female | Yes | Sat | Dinner | 2 |
| 241 | 22.67 | 2.00 | Male | Yes | Sat | Dinner | 2 |
| 242 | 17.82 | 1.75 | Male | No | Sat | Dinner | 2 |
| 243 | 18.78 | 3.00 | Female | No | Thur | Dinner | 2 |
244 rows × 7 columns
Feature engineering#
 1# Create a matrix where the elements contain the sum of the total bills
 2# for each day and are split by smokers/non-smokers:
 3days = ["Thur", "Fri", "Sat", "Sun"]
 4days_range = np.arange(len(days))
 5smoker = ["Yes", "No"]
 6
 7bills_by_days = [dataset[dataset["day"] == day] for day in days]
 8bills_by_days_smoker = [
 9    [bills_by_days[day][bills_by_days[day]["smoker"] == s] for s in smoker]
10    for day in days_range
11]
12total_by_days_smoker = [
13    [
14        bills_by_days_smoker[day][s]["total_bill"].sum()
15        for s in range(len(smoker))
16    ]
17    for day in days_range
18]
19totals = np.asarray(total_by_days_smoker)
20totals
array([[ 326.24,  770.09],
       [ 252.2 ,   73.68],
       [ 893.62,  884.78],
       [ 458.28, 1168.88]])
Visualisation#
 1# Create figure
 2plt.figure(figsize=(10, 5), dpi=300)
 3# Create stacked bar plot
 4plt.bar(days_range, totals[:, 0], label="Smoker")
 5plt.bar(days_range, totals[:, 1], bottom=totals[:, 0], label="Non-smoker")
 6# Add legend
 7plt.legend()
 8# Add labels and title
 9plt.xticks(days_range)
10ax = plt.gca()
11ax.set_xticklabels(days)
12ax.yaxis.grid()
13plt.ylabel("Daily total sales in Euro")
14plt.title("Restaurant performance")
15# Show plot
16plt.show()
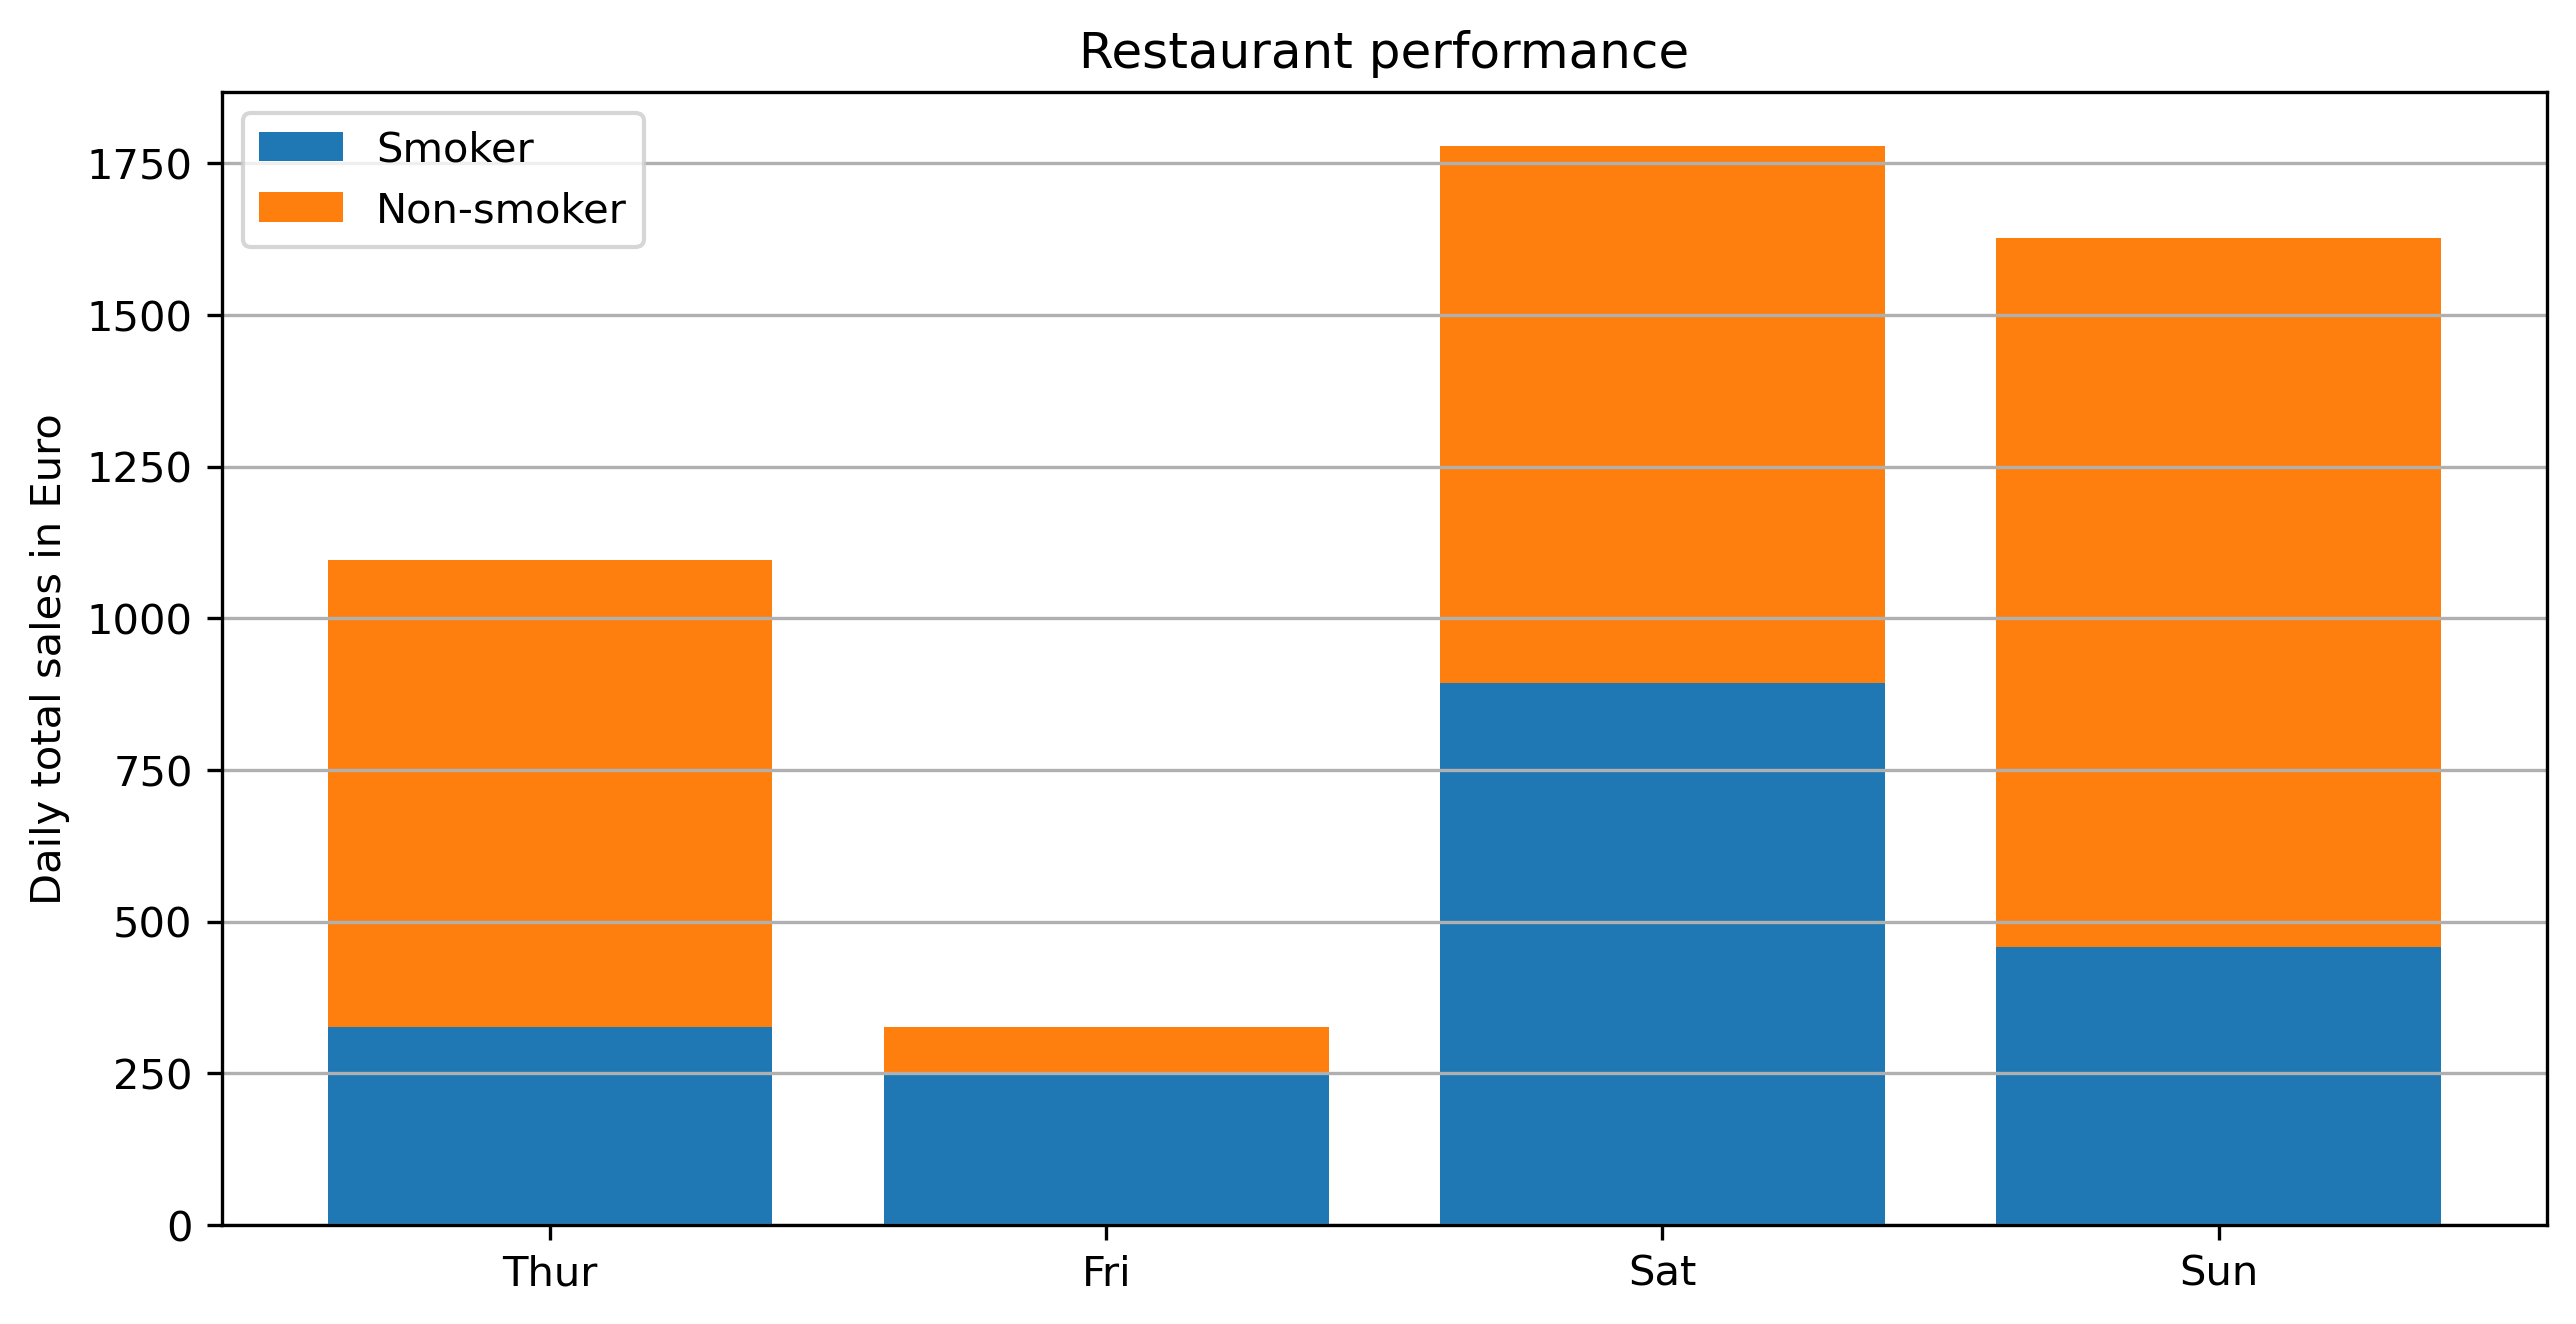
Sunday and Thursday :)