
Simple plot#
Creating a first simple plot using Matplotlib.
Importing libraries and packages#
1# Plotting
2import matplotlib.pyplot as plt
3
4# Warnings
5import warnings
6
7warnings.filterwarnings("ignore")
8
9%matplotlib inline
Set paths#
1# Path to datasets directory
2data_path = "./datasets"
3# Path to assets directory (for saving results to)
4assets_path = "./assets"
Visualisation#
1plt.figure(dpi=200)
<Figure size 1200x800 with 0 Axes>
<Figure size 1200x800 with 0 Axes>
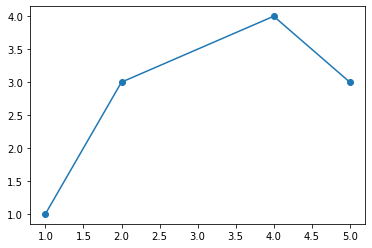
1plt.plot([1, 2, 4, 5], [1, 3, 4, 3], "-o")
2plt.show()
1plt.savefig(f"{assets_path}/TooSimple.png", bbox_inches="tight")
<Figure size 432x288 with 0 Axes>