Stock trends#
Creating a line plot to show stock trends.
Importing libraries and packages#
 1# Mathematical operations and data manipulation
 2import pandas as pd
 3import numpy as np
 4
 5# Plotting
 6import matplotlib.pyplot as plt
 7
 8# Warnings
 9import warnings
10
11warnings.filterwarnings("ignore")
12
13%matplotlib inline
Set paths#
1# Path to datasets directory
2data_path = "./datasets"
3# Path to assets directory (for saving results to)
4assets_path = "./assets"
Loading datasets#
1google = pd.read_csv(f"{data_path}/GOOGL_data.csv")
2facebook = pd.read_csv(f"{data_path}/FB_data.csv")
3apple = pd.read_csv(f"{data_path}/AAPL_data.csv")
4amazon = pd.read_csv(f"{data_path}/AMZN_data.csv")
5microsoft = pd.read_csv(f"{data_path}/MSFT_data.csv")
Exploring datasets#
1# Shape of the dataset
2print("Shape of the dataset: ", google.shape)
3# Head
4google
Shape of the dataset: (1259, 7)
| date | open | high | low | close | volume | Name | |
|---|---|---|---|---|---|---|---|
| 0 | 2013-02-08 | 390.4551 | 393.7283 | 390.1698 | 393.0777 | 6031199 | GOOGL |
| 1 | 2013-02-11 | 389.5892 | 391.8915 | 387.2619 | 391.6012 | 4330781 | GOOGL |
| 2 | 2013-02-12 | 391.2659 | 394.3440 | 390.0747 | 390.7403 | 3714176 | GOOGL |
| 3 | 2013-02-13 | 390.4551 | 393.0677 | 390.3750 | 391.8214 | 2393946 | GOOGL |
| 4 | 2013-02-14 | 390.2549 | 394.7644 | 389.2739 | 394.3039 | 3466971 | GOOGL |
| ... | ... | ... | ... | ... | ... | ... | ... |
| 1254 | 2018-02-01 | 1175.9900 | 1187.4500 | 1169.3600 | 1181.5900 | 3675709 | GOOGL |
| 1255 | 2018-02-02 | 1127.4200 | 1131.3000 | 1111.1700 | 1119.2000 | 5892122 | GOOGL |
| 1256 | 2018-02-05 | 1100.6100 | 1114.9900 | 1056.7400 | 1062.3900 | 4177469 | GOOGL |
| 1257 | 2018-02-06 | 1033.9800 | 1087.3800 | 1030.0100 | 1084.4300 | 3831524 | GOOGL |
| 1258 | 2018-02-07 | 1084.9700 | 1086.5300 | 1054.6200 | 1055.4100 | 2597094 | GOOGL |
1259 rows × 7 columns
1# Shape of the dataset
2print("Shape of the dataset: ", facebook.shape)
3# Head
4facebook
Shape of the dataset: (1259, 7)
| date | open | high | low | close | volume | Name | |
|---|---|---|---|---|---|---|---|
| 0 | 2013-02-08 | 28.89 | 29.1700 | 28.51 | 28.5450 | 37662614 | FB |
| 1 | 2013-02-11 | 28.61 | 28.6800 | 28.04 | 28.2600 | 36979533 | FB |
| 2 | 2013-02-12 | 27.67 | 28.1600 | 27.10 | 27.3700 | 93417215 | FB |
| 3 | 2013-02-13 | 27.36 | 28.3200 | 27.31 | 27.9075 | 50100805 | FB |
| 4 | 2013-02-14 | 28.02 | 28.6300 | 28.01 | 28.5000 | 35581045 | FB |
| ... | ... | ... | ... | ... | ... | ... | ... |
| 1254 | 2018-02-01 | 188.22 | 195.3200 | 187.89 | 193.0900 | 54211293 | FB |
| 1255 | 2018-02-02 | 192.04 | 194.2100 | 189.98 | 190.2800 | 26677484 | FB |
| 1256 | 2018-02-05 | 186.93 | 190.6100 | 180.61 | 181.2600 | 33128206 | FB |
| 1257 | 2018-02-06 | 178.57 | 185.7700 | 177.74 | 185.3100 | 37758505 | FB |
| 1258 | 2018-02-07 | 184.15 | 185.0817 | 179.95 | 180.1800 | 27601886 | FB |
1259 rows × 7 columns
1# Shape of the dataset
2print("Shape of the dataset: ", apple.shape)
3# Head
4apple
Shape of the dataset: (1259, 7)
| date | open | high | low | close | volume | Name | |
|---|---|---|---|---|---|---|---|
| 0 | 2013-02-08 | 67.7142 | 68.4014 | 66.8928 | 67.8542 | 158168416 | AAPL |
| 1 | 2013-02-11 | 68.0714 | 69.2771 | 67.6071 | 68.5614 | 129029425 | AAPL |
| 2 | 2013-02-12 | 68.5014 | 68.9114 | 66.8205 | 66.8428 | 151829363 | AAPL |
| 3 | 2013-02-13 | 66.7442 | 67.6628 | 66.1742 | 66.7156 | 118721995 | AAPL |
| 4 | 2013-02-14 | 66.3599 | 67.3771 | 66.2885 | 66.6556 | 88809154 | AAPL |
| ... | ... | ... | ... | ... | ... | ... | ... |
| 1254 | 2018-02-01 | 167.1650 | 168.6200 | 166.7600 | 167.7800 | 47230787 | AAPL |
| 1255 | 2018-02-02 | 166.0000 | 166.8000 | 160.1000 | 160.5000 | 86593825 | AAPL |
| 1256 | 2018-02-05 | 159.1000 | 163.8800 | 156.0000 | 156.4900 | 72738522 | AAPL |
| 1257 | 2018-02-06 | 154.8300 | 163.7200 | 154.0000 | 163.0300 | 68243838 | AAPL |
| 1258 | 2018-02-07 | 163.0850 | 163.4000 | 159.0685 | 159.5400 | 51608580 | AAPL |
1259 rows × 7 columns
1# Shape of the dataset
2print("Shape of the dataset: ", amazon.shape)
3# Head
4amazon
Shape of the dataset: (1259, 7)
| date | open | high | low | close | volume | Name | |
|---|---|---|---|---|---|---|---|
| 0 | 2013-02-08 | 261.40 | 265.25 | 260.555 | 261.95 | 3879078 | AMZN |
| 1 | 2013-02-11 | 263.20 | 263.25 | 256.600 | 257.21 | 3403403 | AMZN |
| 2 | 2013-02-12 | 259.19 | 260.16 | 257.000 | 258.70 | 2938660 | AMZN |
| 3 | 2013-02-13 | 261.53 | 269.96 | 260.300 | 269.47 | 5292996 | AMZN |
| 4 | 2013-02-14 | 267.37 | 270.65 | 265.400 | 269.24 | 3462780 | AMZN |
| ... | ... | ... | ... | ... | ... | ... | ... |
| 1254 | 2018-02-01 | 1445.00 | 1459.88 | 1385.140 | 1390.00 | 9113808 | AMZN |
| 1255 | 2018-02-02 | 1477.39 | 1498.00 | 1414.000 | 1429.95 | 11125722 | AMZN |
| 1256 | 2018-02-05 | 1402.62 | 1458.98 | 1320.720 | 1390.00 | 11494985 | AMZN |
| 1257 | 2018-02-06 | 1361.46 | 1443.99 | 1351.790 | 1442.84 | 11066819 | AMZN |
| 1258 | 2018-02-07 | 1449.00 | 1460.99 | 1415.150 | 1416.78 | 7162741 | AMZN |
1259 rows × 7 columns
1# Shape of the dataset
2print("Shape of the dataset: ", microsoft.shape)
3# Head
4microsoft
Shape of the dataset: (1259, 7)
| date | open | high | low | close | volume | Name | |
|---|---|---|---|---|---|---|---|
| 0 | 2013-02-08 | 27.35 | 27.710 | 27.3100 | 27.55 | 33318306 | MSFT |
| 1 | 2013-02-11 | 27.65 | 27.920 | 27.5000 | 27.86 | 32247549 | MSFT |
| 2 | 2013-02-12 | 27.88 | 28.000 | 27.7500 | 27.88 | 35990829 | MSFT |
| 3 | 2013-02-13 | 27.93 | 28.110 | 27.8800 | 28.03 | 41715530 | MSFT |
| 4 | 2013-02-14 | 27.92 | 28.060 | 27.8700 | 28.04 | 32663174 | MSFT |
| ... | ... | ... | ... | ... | ... | ... | ... |
| 1254 | 2018-02-01 | 94.79 | 96.070 | 93.5813 | 94.26 | 47227882 | MSFT |
| 1255 | 2018-02-02 | 93.64 | 93.970 | 91.5000 | 91.78 | 47867753 | MSFT |
| 1256 | 2018-02-05 | 90.56 | 93.240 | 88.0000 | 88.00 | 51031465 | MSFT |
| 1257 | 2018-02-06 | 86.89 | 91.475 | 85.2500 | 91.33 | 67998564 | MSFT |
| 1258 | 2018-02-07 | 90.49 | 91.770 | 89.2000 | 89.61 | 41107592 | MSFT |
1259 rows × 7 columns
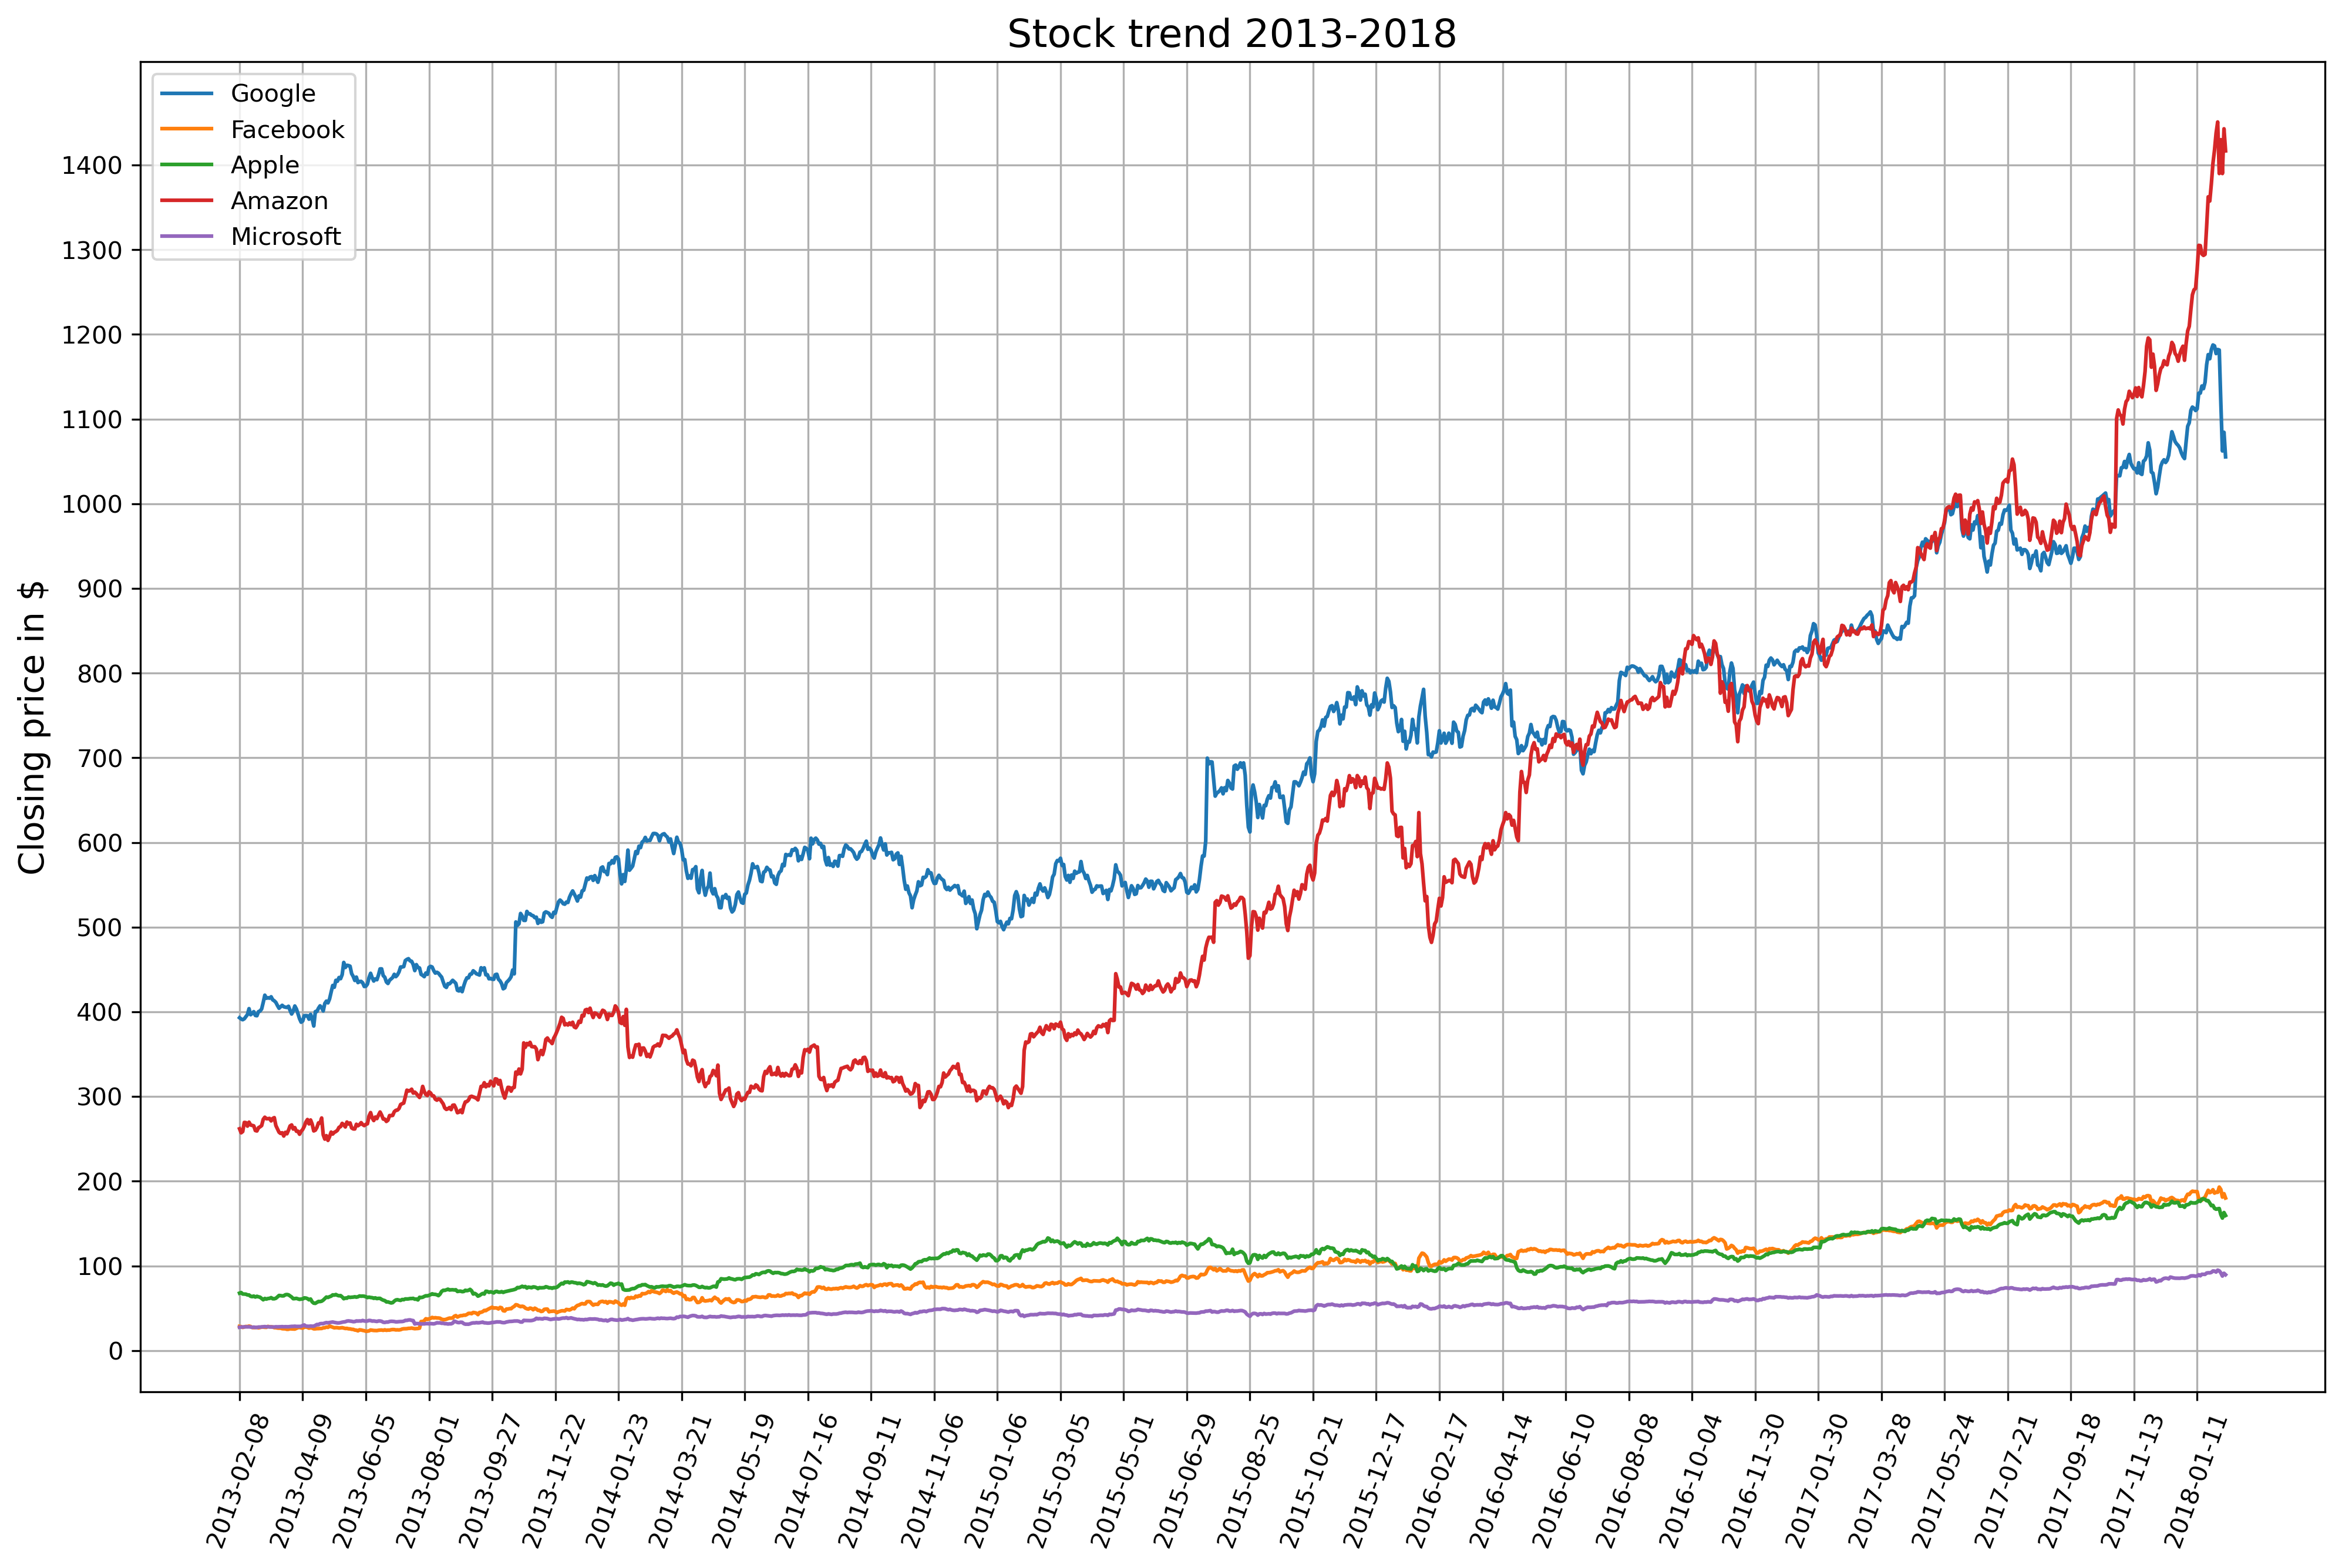
Visualisation#
 1# Create figure
 2plt.figure(figsize=(16, 10), dpi=300)
 3# Plot data
 4plt.plot("date", "close", data=google, label="Google")
 5plt.plot("date", "close", data=facebook, label="Facebook")
 6plt.plot("date", "close", data=apple, label="Apple")
 7plt.plot("date", "close", data=amazon, label="Amazon")
 8plt.plot("date", "close", data=microsoft, label="Microsoft")
 9
10# Add legends etc.
11# Specify ticks for x and y-axis
12plt.xticks(np.arange(0, 1260, 40), rotation=70)
13plt.yticks(np.arange(0, 1450, 100))
14# Add title and label for y-axis
15plt.title("Stock trend 2013-2018", fontsize=16)
16plt.ylabel("Closing price in $", fontsize=14)
17# Add grid
18plt.grid()
19# Add legend
20plt.legend()
21# Show plot
22plt.show()