IQ scores#
Comparing IQ scores among different test groups using a box plot of the Seaborn library and quickly change the style and context of a Figure using the pre-configurations supplied by Seaborn.
Once a suitable DataFrame exists, the plotting is achieved with a single function. Column names are automatically used for labeling the axis. Even categorical variables are supported out of the box.
Importing libraries and packages#
 1# Warnings
 2import warnings
 3
 4# Mathematical operations and data manipulation
 5import pandas as pd
 6
 7# Plotting
 8import matplotlib.pyplot as plt
 9import seaborn as sns
10
11warnings.filterwarnings("ignore")
Set paths#
1# Path to datasets directory
2data_path = "./datasets"
3# Path to assets directory (for saving results to)
4assets_path = "./assets"
Loading dataset#
1dataset = pd.read_csv(f"{data_path}/iq_scores.csv")
Exploring dataset#
1# Shape of the dataset
2print("Shape of the dataset: ", dataset.shape)
3# View
4dataset
Shape of the dataset: (100, 4)
| group_a | group_b | group_c | group_d | |
|---|---|---|---|---|
| 0 | 118 | 126 | 108 | 93 |
| 1 | 103 | 89 | 89 | 99 |
| 2 | 125 | 90 | 114 | 91 |
| 3 | 107 | 101 | 116 | 110 |
| 4 | 111 | 102 | 126 | 80 |
| ... | ... | ... | ... | ... |
| 95 | 88 | 91 | 102 | 105 |
| 96 | 122 | 112 | 69 | 74 |
| 97 | 125 | 102 | 96 | 85 |
| 98 | 93 | 112 | 101 | 85 |
| 99 | 78 | 75 | 90 | 95 |
100 rows × 4 columns
Preprocessing#
1group_a = dataset[dataset.columns[0]].tolist()
2group_b = dataset[dataset.columns[1]].tolist()
3group_c = dataset[dataset.columns[2]].tolist()
4group_d = dataset[dataset.columns[3]].tolist()
1# Testing
2print(group_a)
3print(group_b)
4print(group_c)
5print(group_d)
[118, 103, 125, 107, 111, 96, 104, 97, 96, 114, 96, 75, 114, 107, 87, 117, 117, 114, 117, 112, 107, 133, 94, 91, 118, 110, 117, 86, 143, 83, 106, 86, 98, 126, 109, 91, 112, 120, 108, 111, 107, 98, 89, 113, 117, 81, 113, 112, 84, 115, 96, 93, 128, 115, 138, 121, 87, 112, 110, 79, 100, 84, 115, 93, 108, 130, 107, 106, 106, 101, 117, 93, 94, 103, 112, 98, 103, 70, 139, 94, 110, 105, 122, 94, 94, 105, 129, 110, 112, 97, 109, 121, 106, 118, 131, 88, 122, 125, 93, 78]
[126, 89, 90, 101, 102, 74, 93, 101, 66, 120, 108, 97, 98, 105, 119, 92, 113, 81, 104, 108, 83, 102, 105, 111, 102, 107, 103, 89, 89, 110, 71, 110, 120, 85, 111, 83, 122, 120, 102, 84, 118, 100, 100, 114, 81, 109, 69, 97, 95, 106, 116, 109, 114, 98, 90, 92, 98, 91, 81, 85, 86, 102, 93, 112, 76, 89, 110, 75, 110, 90, 96, 94, 107, 108, 95, 96, 96, 114, 93, 95, 117, 141, 115, 95, 86, 100, 121, 103, 66, 99, 96, 111, 110, 105, 110, 91, 112, 102, 112, 75]
[108, 89, 114, 116, 126, 104, 113, 96, 69, 121, 109, 102, 107, 122, 104, 107, 108, 137, 107, 116, 98, 132, 108, 114, 82, 93, 89, 90, 86, 91, 99, 98, 83, 93, 114, 96, 95, 113, 103, 81, 107, 85, 116, 85, 107, 125, 126, 123, 122, 124, 115, 114, 93, 93, 114, 107, 107, 84, 131, 91, 108, 127, 112, 106, 115, 82, 90, 117, 108, 115, 113, 108, 104, 103, 90, 110, 114, 92, 101, 72, 109, 94, 122, 90, 102, 86, 119, 103, 110, 96, 90, 110, 96, 69, 85, 102, 69, 96, 101, 90]
[93, 99, 91, 110, 80, 113, 111, 115, 98, 74, 96, 80, 83, 102, 60, 91, 82, 90, 97, 101, 89, 89, 117, 91, 104, 104, 102, 128, 106, 111, 79, 92, 97, 101, 106, 110, 93, 93, 106, 108, 85, 83, 108, 94, 79, 87, 113, 112, 111, 111, 79, 116, 104, 84, 116, 111, 103, 103, 112, 68, 54, 80, 86, 119, 81, 84, 91, 96, 116, 125, 99, 58, 102, 77, 98, 100, 90, 106, 109, 114, 102, 102, 112, 103, 98, 96, 85, 97, 110, 131, 92, 79, 115, 122, 95, 105, 74, 85, 85, 95]
 1data = pd.DataFrame(
 2    {
 3        "Groups": ["Group A"] * len(group_a)
 4        + ["Group B"] * len(group_b)
 5        + ["Group C"] * len(group_c)
 6        + ["Group D"] * len(group_d),
 7        "IQ score": group_a + group_b + group_c + group_d,
 8    }
 9)
10
11print(data.columns)
12data
Index(['Groups', 'IQ score'], dtype='object')
| Groups | IQ score | |
|---|---|---|
| 0 | Group A | 118 |
| 1 | Group A | 103 |
| 2 | Group A | 125 |
| 3 | Group A | 107 |
| 4 | Group A | 111 |
| ... | ... | ... |
| 395 | Group D | 105 |
| 396 | Group D | 74 |
| 397 | Group D | 85 |
| 398 | Group D | 85 |
| 399 | Group D | 95 |
400 rows × 2 columns
Visualisation#
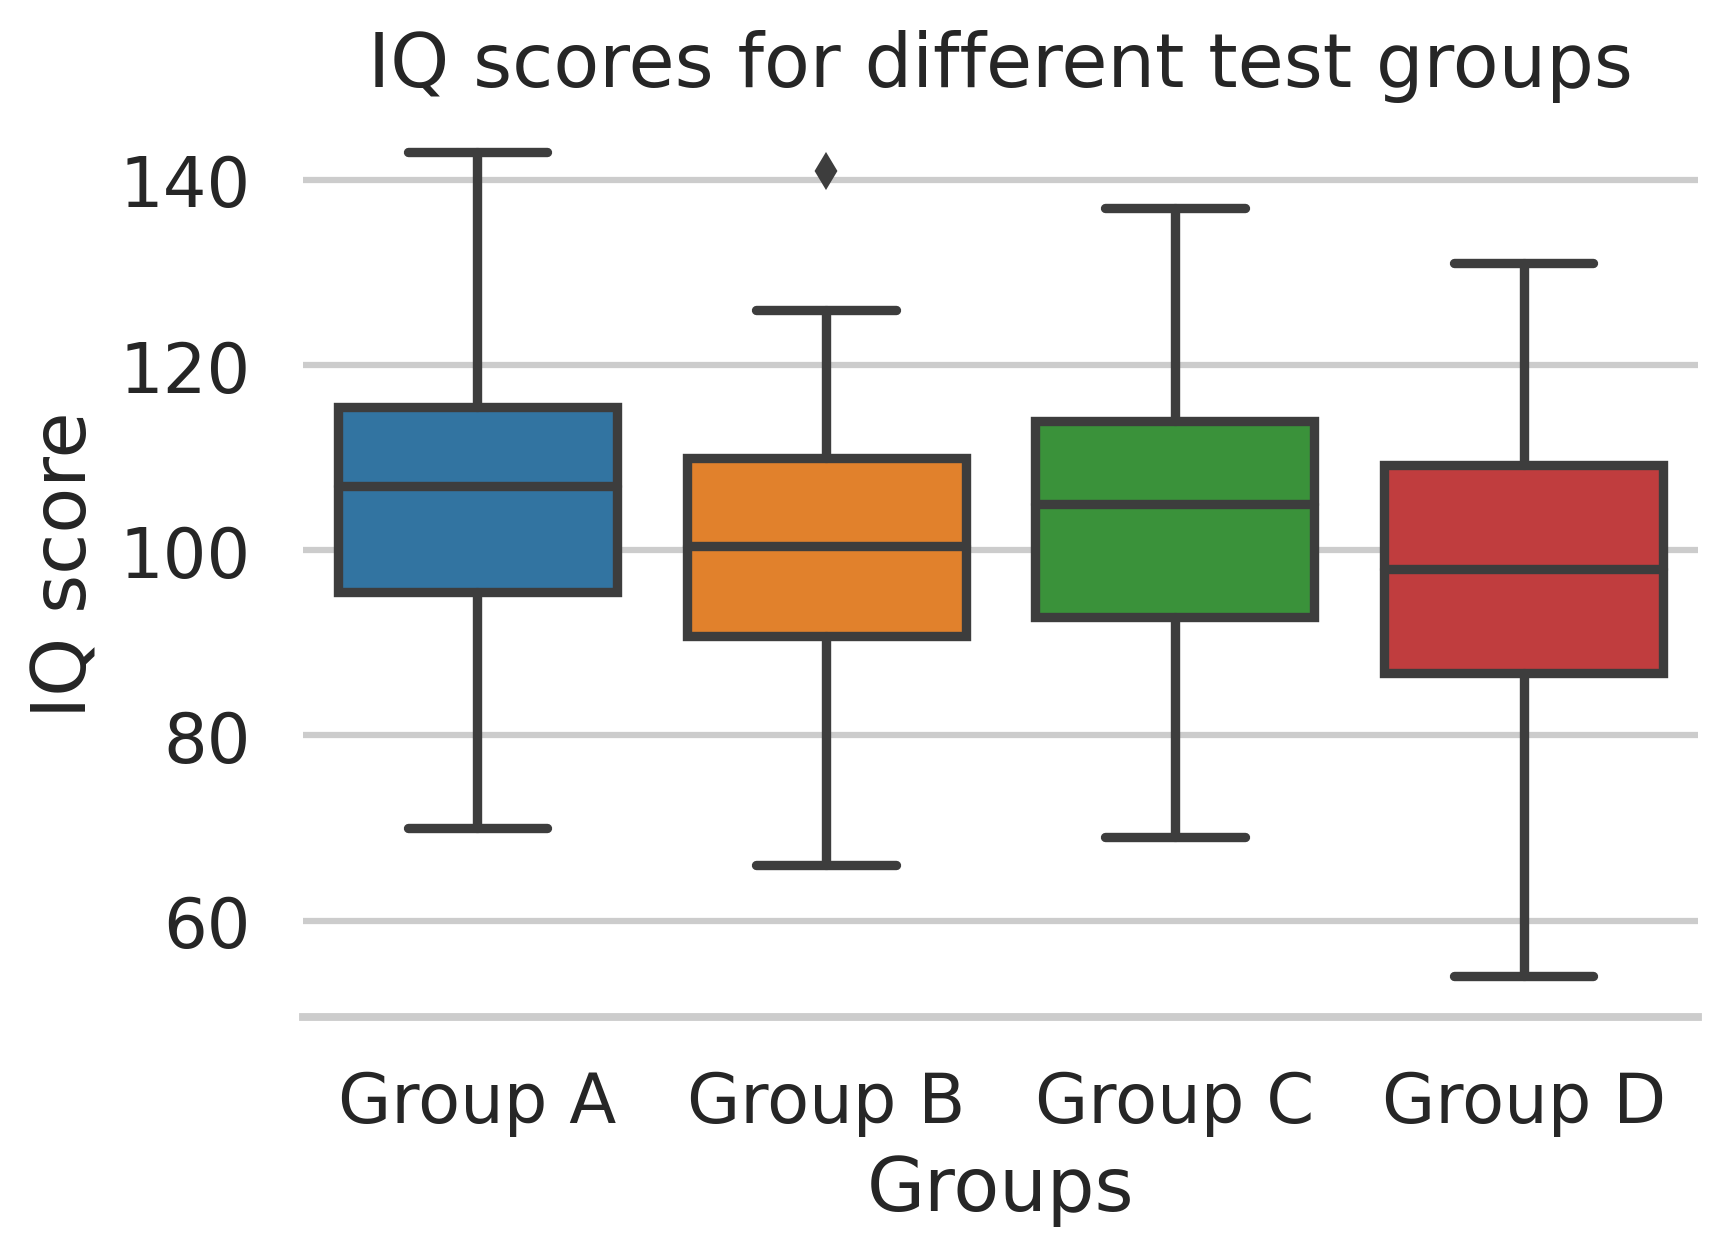
Box plot#
 1plt.figure(dpi=300)
 2# Set style to 'whitegrid'
 3sns.set_style("whitegrid")
 4# Set context to 'talk' to use the data visualization in a slide/talk
 5sns.set_context("talk")
 6# Create boxplot
 7sns.boxplot("Groups", "IQ score", data=data)
 8# Despine removes spines from the plot by default (without passing any
 9# arguments to the function)
10sns.despine(left=True, right=True, top=True)
11# Add title
12plt.title("IQ scores for different test groups")
13# Show plot
14plt.show()
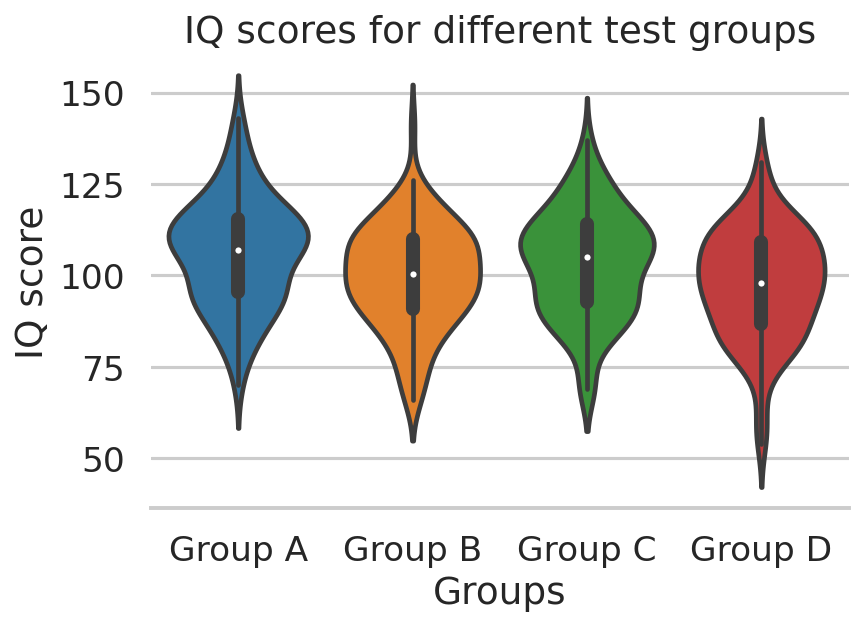
Violin plot#
 1plt.figure(dpi=150)
 2# Set style
 3sns.set_style("whitegrid")
 4# Create boxplot
 5sns.violinplot("Groups", "IQ score", data=data)
 6# Despine
 7sns.despine(left=True, right=True, top=True)
 8# Add title
 9plt.title("IQ scores for different test groups")
10# Show plot
11plt.show()