Tomatometer#
Compare with Tomatometer plot made with Matplotlib
Importing libraries and packages#
 1# Warnings
 2import warnings
 3
 4# Mathematical operations and data manipulation
 5import pandas as pd
 6
 7# Plotting
 8import matplotlib.pyplot as plt
 9import seaborn as sns
10
11sns.set()
12warnings.filterwarnings("ignore")
Set paths#
1# Path to datasets directory
2data_path = "./datasets"
3# Path to assets directory (for saving results to)
4assets_path = "./assets"
Loading dataset#
1dataset = pd.read_csv(f"{data_path}/movie_scores.csv", index_col=0)
Exploring dataset#
1# Shape of the dataset
2print("Shape of the dataset: ", dataset.shape)
3# View
4dataset
Shape of the dataset: (5, 3)
| MovieTitle | Tomatometer | AudienceScore | |
|---|---|---|---|
| 0 | The Shape of Water | 91 | 73 |
| 1 | Black Panther | 97 | 79 |
| 2 | Dunkirk | 92 | 81 |
| 3 | The Martian | 91 | 91 |
| 4 | The Hobbit: An Unexpected Journey | 64 | 83 |
Preprocessing#
1movie_scores = pd.DataFrame(
2    {
3        "Movie Title": list(dataset["MovieTitle"]) * 2,
4        "Score": list(dataset["AudienceScore"]) + list(dataset["Tomatometer"]),
5        "Type": ["Audience Score"] * len(dataset["AudienceScore"])
6        + ["Tomatometer"] * len(dataset["Tomatometer"]),
7    }
8)
9movie_scores
| Movie Title | Score | Type | |
|---|---|---|---|
| 0 | The Shape of Water | 73 | Audience Score |
| 1 | Black Panther | 79 | Audience Score |
| 2 | Dunkirk | 81 | Audience Score |
| 3 | The Martian | 91 | Audience Score |
| 4 | The Hobbit: An Unexpected Journey | 83 | Audience Score |
| 5 | The Shape of Water | 91 | Tomatometer |
| 6 | Black Panther | 97 | Tomatometer |
| 7 | Dunkirk | 92 | Tomatometer |
| 8 | The Martian | 91 | Tomatometer |
| 9 | The Hobbit: An Unexpected Journey | 64 | Tomatometer |
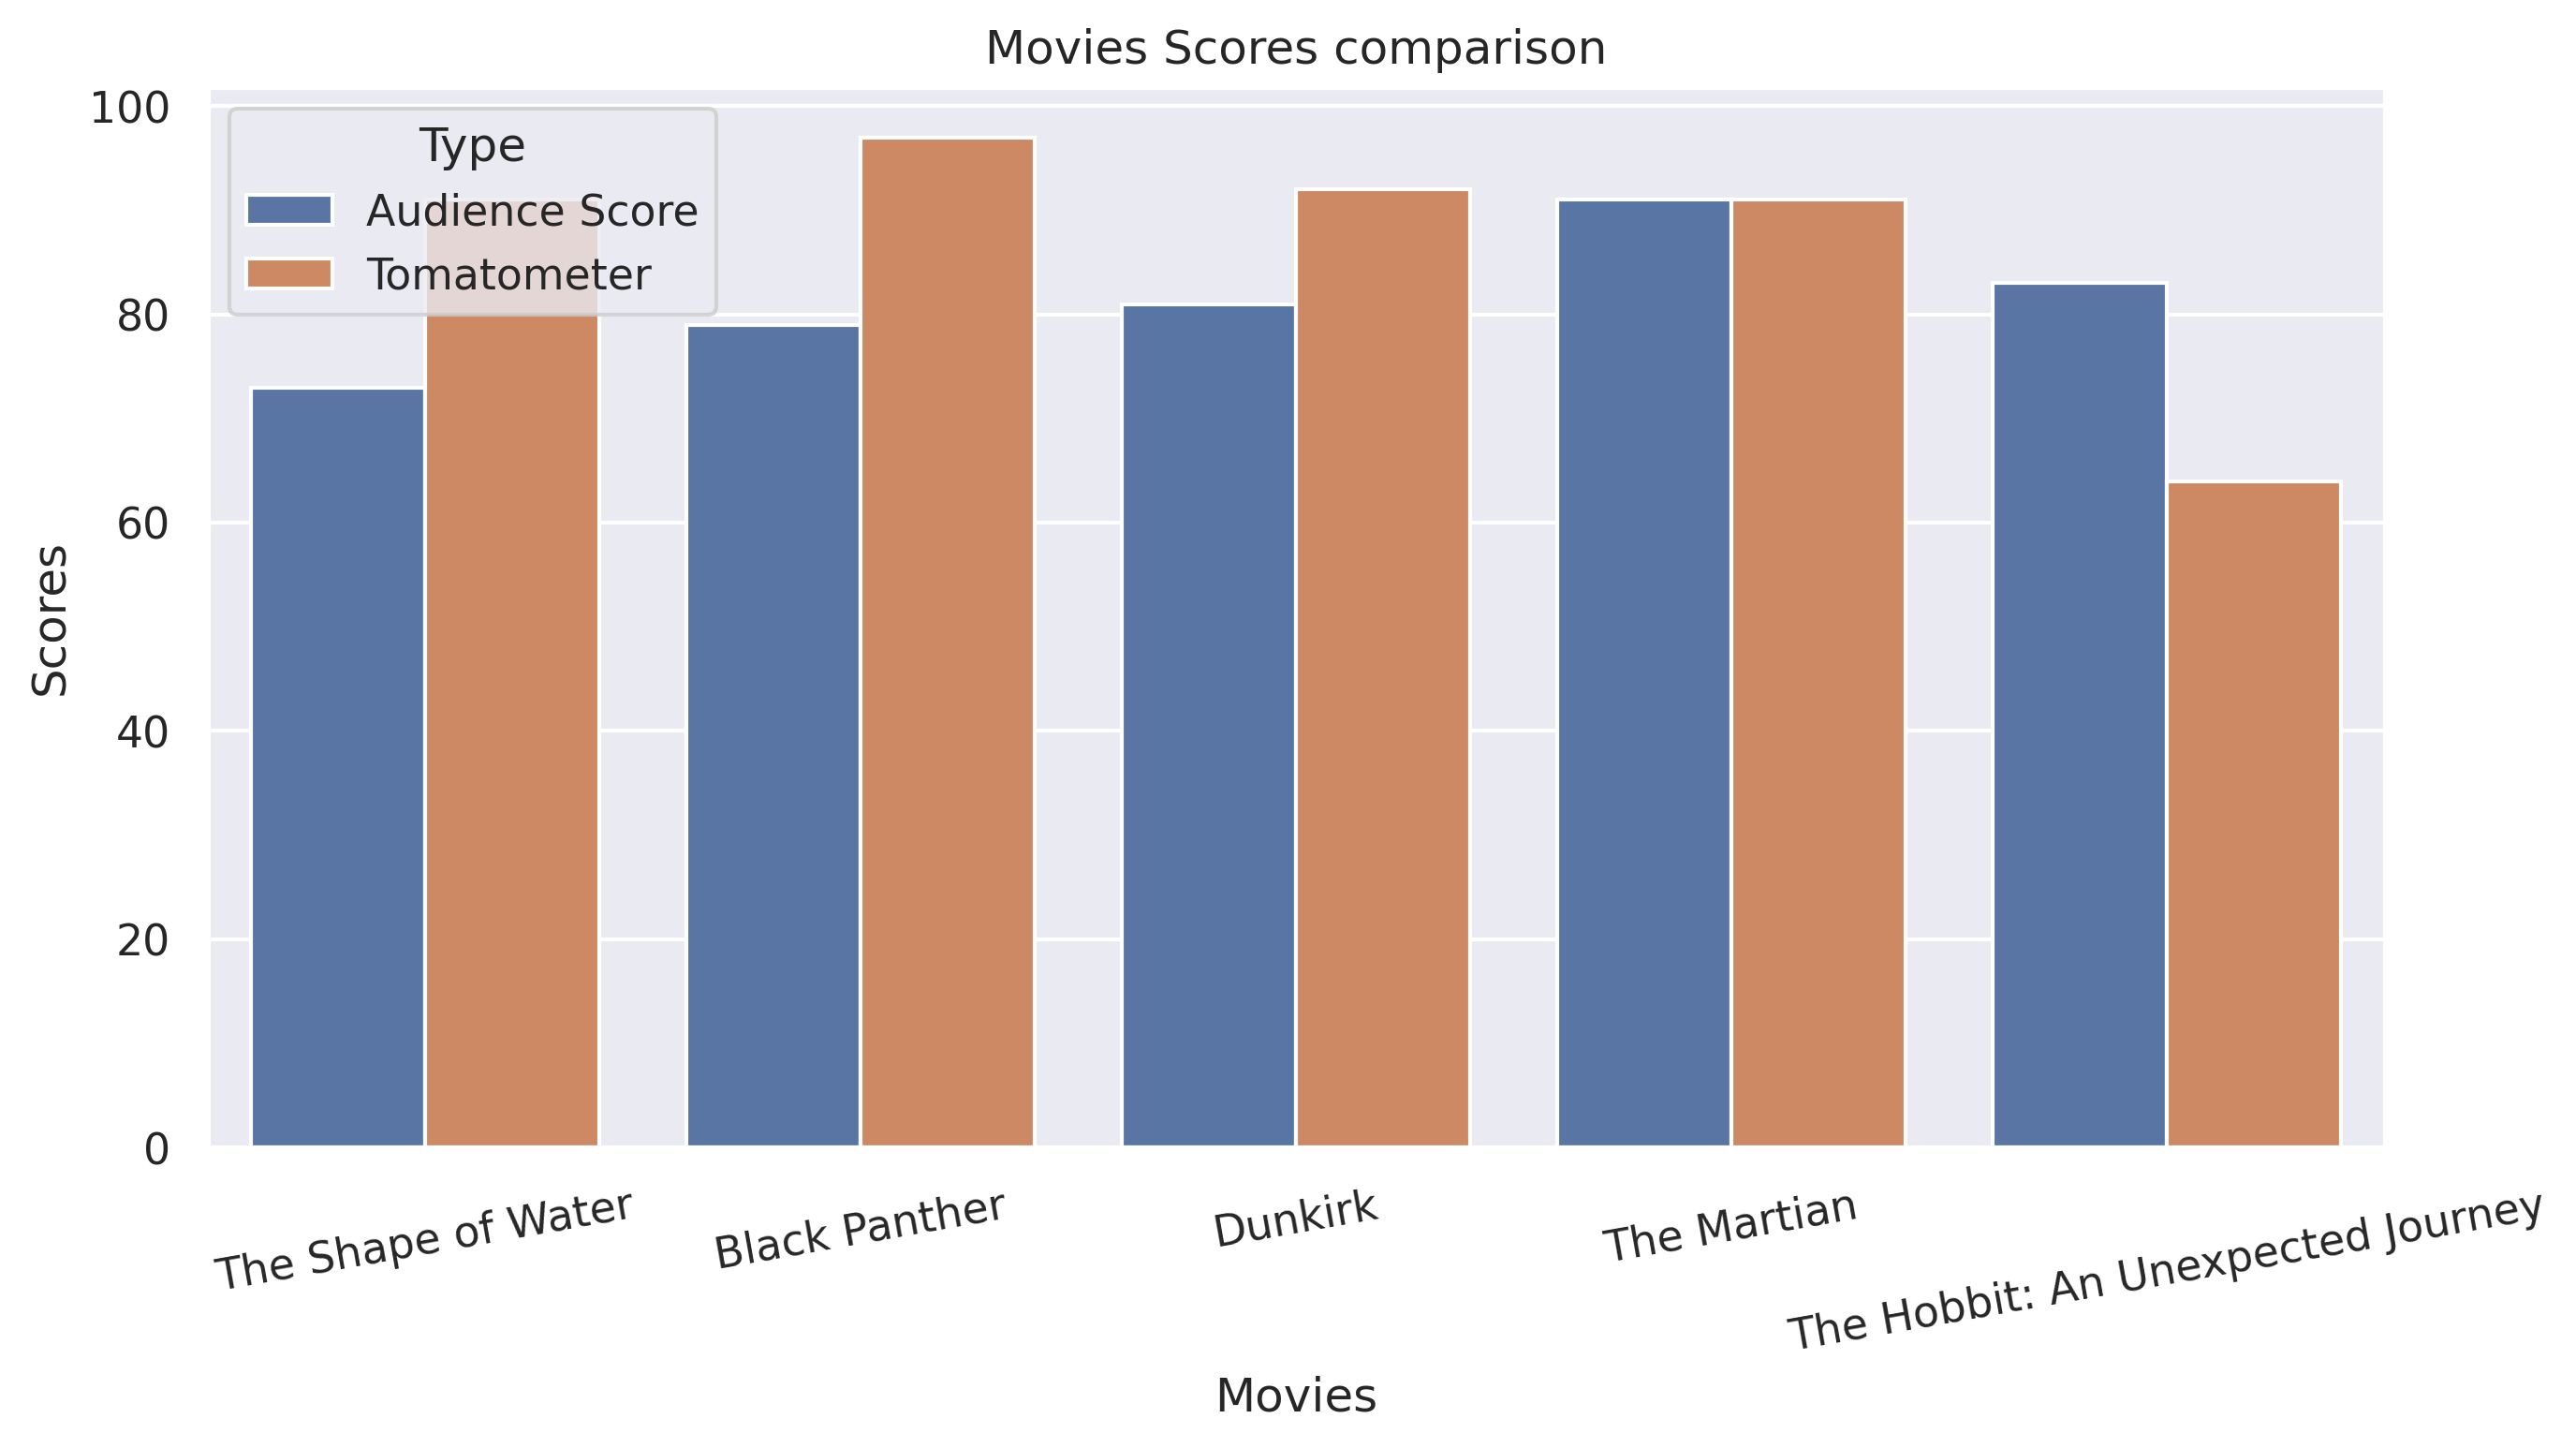
Visualisation#
 1plt.figure(figsize=(10, 5), dpi=300)
 2# Create bar plot
 3ax = sns.barplot("Movie Title", "Score", hue="Type", data=movie_scores)
 4plt.xticks(rotation=10)
 5# Add title
 6plt.title("Movies Scores comparison")
 7plt.xlabel("Movies")
 8plt.ylabel("Scores")
 9# Show plot
10plt.savefig(
11    f"{assets_path}/movie_scores_seaborn.png", dpi=300, bbox_inches="tight"
12)
13plt.show()