Surface temperatures#
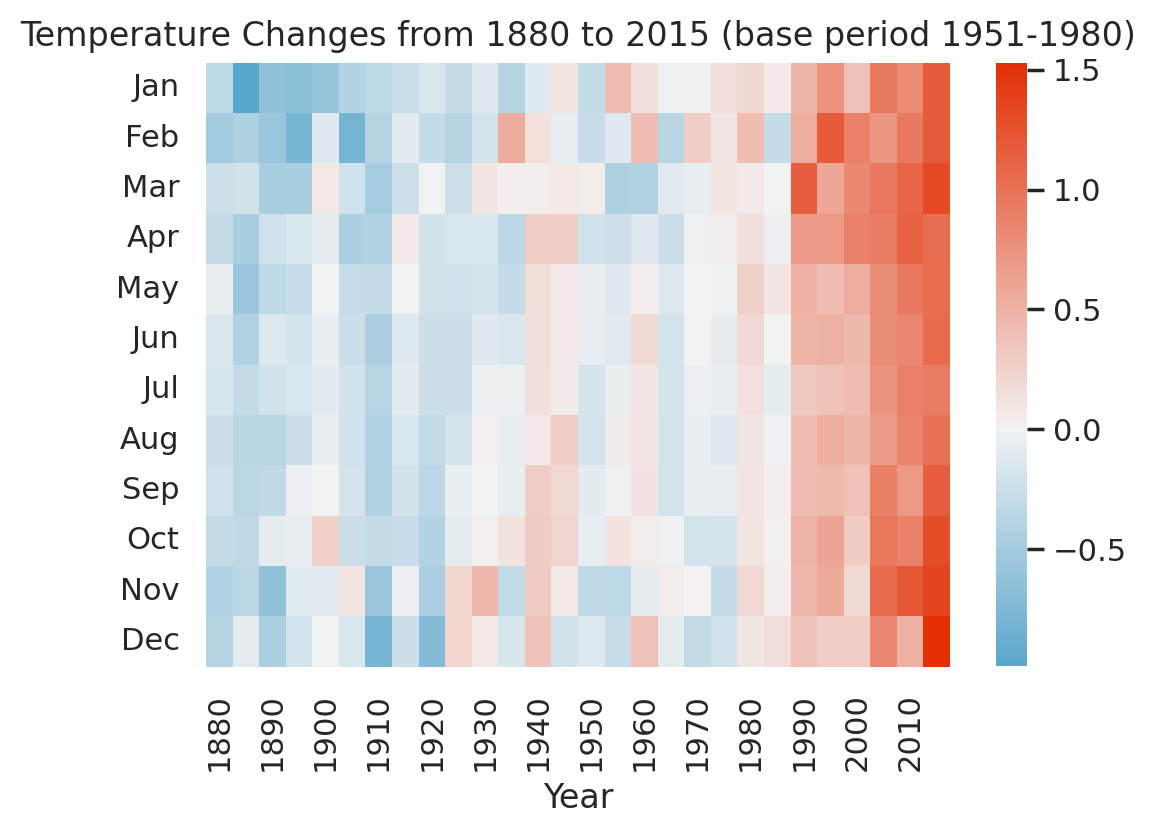
Visualizing the surface temperature change for the Northern Hemisphere for past years.
Importing libraries and packages#
 1# Warnings
 2import warnings
 3
 4# Mathematical operations and data manipulation
 5import pandas as pd
 6
 7# Plotting
 8import matplotlib.pyplot as plt
 9import seaborn as sns
10
11sns.set()
12warnings.filterwarnings("ignore")
Set paths#
1# Path to datasets directory
2data_path = "./datasets"
3# Path to assets directory (for saving results to)
4assets_path = "./assets"
Loading dataset#
1dataset = pd.read_csv(
2    f"{data_path}/northern_surface_temperature.csv", index_col=["Year"]
3)
Exploring dataset#
1# Shape of the dataset
2print("Shape of the dataset: ", dataset.shape)
3# View
4dataset
Shape of the dataset: (139, 12)
| Jan | Feb | Mar | Apr | May | Jun | Jul | Aug | Sep | Oct | Nov | Dec | |
|---|---|---|---|---|---|---|---|---|---|---|---|---|
| Year | ||||||||||||
| 1880 | -0.34 | -0.50 | -0.23 | -0.29 | -0.05 | -0.15 | -0.17 | -0.25 | -0.22 | -0.30 | -0.42 | -0.39 |
| 1881 | -0.30 | -0.21 | -0.03 | 0.01 | 0.04 | -0.32 | 0.09 | -0.03 | -0.25 | -0.42 | -0.35 | -0.22 |
| 1882 | 0.28 | 0.23 | 0.03 | -0.30 | -0.24 | -0.28 | -0.26 | -0.13 | -0.23 | -0.51 | -0.31 | -0.67 |
| 1883 | -0.56 | -0.64 | -0.14 | -0.29 | -0.24 | -0.10 | -0.04 | -0.21 | -0.32 | -0.15 | -0.44 | -0.14 |
| 1884 | -0.16 | -0.11 | -0.63 | -0.59 | -0.36 | -0.40 | -0.44 | -0.49 | -0.44 | -0.43 | -0.55 | -0.46 |
| ... | ... | ... | ... | ... | ... | ... | ... | ... | ... | ... | ... | ... |
| 2014 | 0.97 | 0.71 | 1.20 | 1.08 | 0.90 | 0.81 | 0.76 | 0.89 | 0.83 | 0.93 | 0.79 | 1.10 |
| 2015 | 1.19 | 1.18 | 1.32 | 1.03 | 1.04 | 1.05 | 0.92 | 1.01 | 1.16 | 1.29 | 1.37 | 1.53 |
| 2016 | 1.55 | 1.93 | 1.91 | 1.49 | 1.11 | 1.12 | 1.04 | 1.11 | 1.22 | 1.03 | 1.11 | 1.03 |
| 2017 | 1.39 | 1.50 | 1.51 | 1.20 | 0.92 | 0.93 | 0.96 | 1.01 | 1.00 | 1.05 | 1.23 | 1.40 |
| 2018 | 1.14 | 1.23 | 1.18 | 0.97 | 1.01 | 0.86 | 0.90 | 0.86 | 0.96 | 1.23 | 0.98 | 1.09 |
139 rows × 12 columns
Preprocessing#
1# Transpose the dataset
2dataset = dataset.transpose()
3dataset
| Year | 1880 | 1881 | 1882 | 1883 | 1884 | 1885 | 1886 | 1887 | 1888 | 1889 | ... | 2009 | 2010 | 2011 | 2012 | 2013 | 2014 | 2015 | 2016 | 2017 | 2018 |
|---|---|---|---|---|---|---|---|---|---|---|---|---|---|---|---|---|---|---|---|---|---|
| Jan | -0.34 | -0.30 | 0.28 | -0.56 | -0.16 | -0.99 | -0.71 | -1.05 | -0.46 | -0.25 | ... | 0.83 | 0.81 | 0.61 | 0.67 | 0.86 | 0.97 | 1.19 | 1.55 | 1.39 | 1.14 |
| Feb | -0.50 | -0.21 | 0.23 | -0.64 | -0.11 | -0.43 | -0.80 | -0.67 | -0.57 | 0.33 | ... | 0.70 | 0.94 | 0.57 | 0.59 | 0.79 | 0.71 | 1.18 | 1.93 | 1.50 | 1.23 |
| Mar | -0.23 | -0.03 | 0.03 | -0.14 | -0.63 | -0.21 | -0.69 | -0.41 | -0.60 | 0.00 | ... | 0.60 | 1.10 | 0.88 | 0.72 | 0.81 | 1.20 | 1.32 | 1.91 | 1.51 | 1.18 |
| Apr | -0.29 | 0.01 | -0.30 | -0.29 | -0.59 | -0.47 | -0.34 | -0.35 | -0.18 | 0.18 | ... | 0.70 | 1.13 | 0.85 | 1.07 | 0.68 | 1.08 | 1.03 | 1.49 | 1.20 | 0.97 |
| May | -0.05 | 0.04 | -0.24 | -0.24 | -0.36 | -0.56 | -0.30 | -0.22 | -0.13 | -0.01 | ... | 0.66 | 0.94 | 0.66 | 0.97 | 0.78 | 0.90 | 1.04 | 1.11 | 0.92 | 1.01 |
| Jun | -0.15 | -0.32 | -0.28 | -0.10 | -0.40 | -0.42 | -0.34 | -0.18 | 0.00 | -0.05 | ... | 0.68 | 0.85 | 0.76 | 0.94 | 0.77 | 0.81 | 1.05 | 1.12 | 0.93 | 0.86 |
| Jul | -0.17 | 0.09 | -0.26 | -0.04 | -0.44 | -0.31 | -0.11 | -0.21 | 0.03 | -0.06 | ... | 0.68 | 0.89 | 0.73 | 0.85 | 0.70 | 0.76 | 0.92 | 1.04 | 0.96 | 0.90 |
| Aug | -0.25 | -0.03 | -0.13 | -0.21 | -0.49 | -0.37 | -0.40 | -0.51 | -0.18 | -0.18 | ... | 0.72 | 0.87 | 0.71 | 0.76 | 0.73 | 0.89 | 1.01 | 1.11 | 1.01 | 0.86 |
| Sep | -0.22 | -0.25 | -0.23 | -0.32 | -0.44 | -0.36 | -0.30 | -0.18 | -0.17 | -0.28 | ... | 0.85 | 0.71 | 0.74 | 0.86 | 0.70 | 0.83 | 1.16 | 1.22 | 1.00 | 0.96 |
| Oct | -0.30 | -0.42 | -0.51 | -0.15 | -0.43 | -0.33 | -0.28 | -0.46 | 0.00 | -0.39 | ... | 0.79 | 0.89 | 0.91 | 0.91 | 0.83 | 0.93 | 1.29 | 1.03 | 1.05 | 1.23 |
| Nov | -0.42 | -0.35 | -0.31 | -0.44 | -0.55 | -0.35 | -0.37 | -0.24 | 0.03 | -0.60 | ... | 0.85 | 1.21 | 0.66 | 0.98 | 1.13 | 0.79 | 1.37 | 1.11 | 1.23 | 0.98 |
| Dec | -0.39 | -0.22 | -0.67 | -0.14 | -0.46 | -0.08 | -0.18 | -0.41 | -0.22 | -0.53 | ... | 0.67 | 0.50 | 0.88 | 0.46 | 0.83 | 1.10 | 1.53 | 1.03 | 1.40 | 1.09 |
12 rows × 139 columns
Visualisation#
1heat_colormap = sns.diverging_palette(240, 15, s=99, as_cmap=True)
2# Plotting the heatmap for every 5 years
3plt.figure(dpi=200)
4# To ensure the neutral colour corresponds to no temperature change (= 0),
5# set center=0
6sns.heatmap(dataset.iloc[:, ::5], cmap=heat_colormap, center=0)
7plt.title("Temperature Changes from 1880 to 2015 (base period 1951-1980)")
8plt.show()