
Outliers in numerical data#
Detecting and getting rid of outliers is a time-consuming and critical process in any data wrangling pipeline. They need deep domain knowledge, expertise in descriptive statistics, mastery over the programming language (and all the useful libraries), and a lot of caution. We recommend being very careful when performing this operation on a dataset.
A z-score is a measure on a set of data that gives a value for each data point regarding how much that data point is spread out with respect to the standard deviation and mean of the dataset. The z-score can be used to numerically detect outliers in a set of data. Any data point with a z-score greater than +3 or less than -3 is considered an outlier.
Levenshtein distance is an advanced concept. We can think of it as the minimum number of single-character edits that are needed to convert one string into another. When two strings are identical, the distance between them is 0 – the bigger the difference, the higher the number. We can consider a threshold of distance, under which two strings are considered the same.
Importing libraries and packages#
 1# Mathematical operations and data manipulation
 2import pandas as pd
 3from math import cos, pi
 4from scipy import stats
 5from Levenshtein import distance
 6
 7# Plotting
 8import matplotlib.pyplot as plt
 9
10%matplotlib inline
Detecing outliers in numerical data#
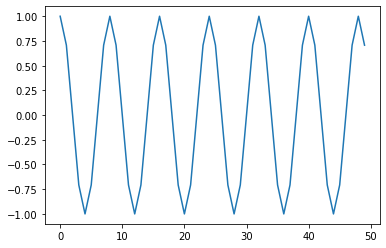
1ys = [cos(i * (pi / 4)) for i in range(50)]
2plt.plot(ys)
[<matplotlib.lines.Line2D at 0x7fcb1fc58700>]
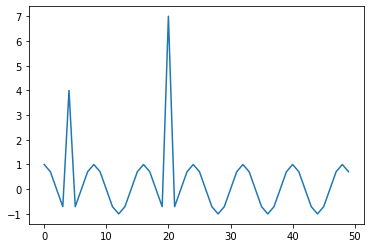
1# Introducing outliers
2ys[4] = ys[4] + 5.0
3ys[20] = ys[20] + 8.0
4plt.plot(ys)
[<matplotlib.lines.Line2D at 0x7fcb17b5cfa0>]
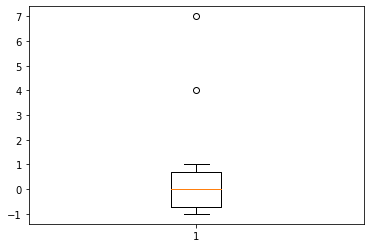
1# Boxplotting for visual cues on outliers
2plt.boxplot(ys)
{'whiskers': [<matplotlib.lines.Line2D at 0x7fcb17ad9760>,
  <matplotlib.lines.Line2D at 0x7fcb17ad9a30>],
 'caps': [<matplotlib.lines.Line2D at 0x7fcb17ad9dc0>,
  <matplotlib.lines.Line2D at 0x7fcb17ad9fd0>],
 'boxes': [<matplotlib.lines.Line2D at 0x7fcb17ad9490>],
 'medians': [<matplotlib.lines.Line2D at 0x7fcb17af02e0>],
 'fliers': [<matplotlib.lines.Line2D at 0x7fcb17af05b0>],
 'means': []}
The Z-Score value#
1df_original = pd.DataFrame(ys)
2cos_arr_z_score = stats.zscore(ys)
3cos_arr_without_outliers = df_original[(cos_arr_z_score < 3)]
4
5print(cos_arr_without_outliers.shape)
6print(df_original.shape)
(49, 1)
(50, 1)
Fuzzy string matching#
 1# A problem that may look like an outlier, but is not.
 2# Creating the load data of a ship on three different dates:
 3ship_data = {
 4    "Sea Princess": {"date": "12/08/20", "load": 40000},
 5    "Sea Pincess": {"date": "10/06/20", "load": 30000},
 6    "Sea Princes": {"date": "12/04/20", "load": 30000},
 7}
 8
 9# Passing two strings to the distance function to calculate
10# distance between them
11name_of_ship = "Sea Princess"
12for k, v in ship_data.items():
13    print("{} {} {}".format(k, name_of_ship, distance(name_of_ship, k)))
Sea Princess Sea Princess 0
Sea Pincess Sea Princess 1
Sea Princes Sea Princess 1