
Rinse and repeat#
The visit_data.csv file contains data generated by a random data generator, and contains fake people’s names, their gender, email_id, ip_address, and the number of visits they made to a particular web page.
Importing libraries and packages#
1# Mathematical operations and data manipulation
2import numpy as np
3import pandas as pd
4
5# Plotting
6import matplotlib.pyplot as plt
7
8%matplotlib inline
Set paths#
1# Path to datasets directory
2data_path = "./datasets"
3# Path to assets directory (for saving results to)
4assets_path = "./assets"
Loading dataset#
1dataset = pd.read_csv(f"{data_path}/visit_data.csv")
2dataset.head()
| id | first_name | last_name | gender | ip_address | visit | ||
|---|---|---|---|---|---|---|---|
| 0 | 1 | Sonny | Dahl | sdahl0@mysql.com | Male | 135.36.96.183 | 1225.0 |
| 1 | 2 | NaN | NaN | dhoovart1@hud.gov | NaN | 237.165.194.143 | 919.0 |
| 2 | 3 | Gar | Armal | garmal2@technorati.com | NaN | 166.43.137.224 | 271.0 |
| 3 | 4 | Chiarra | Nulty | cnulty3@newyorker.com | NaN | 139.98.137.108 | 1002.0 |
| 4 | 5 | NaN | NaN | sleaver4@elegantthemes.com | NaN | 46.117.117.27 | 2434.0 |
Wrangling#
1print(
2    "First name is duplicated - {}".format(
3        any(dataset.first_name.duplicated())
4    )
5)
6print(
7    "Last name is duplicated - {}".format(any(dataset.last_name.duplicated()))
8)
9print("Email is duplicated - {}".format(any(dataset.email.duplicated())))
First name is duplicated - True
Last name is duplicated - True
Email is duplicated - False
 1# Different ways to format boolean values for the % op-erator
 2print(
 3    "The column Email contains NaN - %r " % dataset.email.isnull().values.any()
 4)
 5print(
 6    "The column IP Address contains NaN - %s "
 7    % dataset.ip_address.isnull().values.any()
 8)
 9print(
10    "The column Visit contains NaN - %s " % dataset.visit.isnull().values.any()
11)
The column Email contains NaN - False
The column IP Address contains NaN - False
The column Visit contains NaN - True
 1# numpy.isfinite tests element-wise for finiteness (not infinity and not
 2# Not a Number).
 3# Store the previous size of the dataset for comparison with the new size
 4size_prev = dataset.shape
 5df = dataset[np.isfinite(dataset["visit"])]  # This is an inplace operation.
 6size_after = df.shape
 7
 8print(
 9    "The size of previous data was - {prev[0]} rows and the size of the "
10    "new one is - {after[0]} rows".format(prev=size_prev, after=size_after)
11)
The size of previous data was - 1000 rows and the size of the new one is - 974 rows
1plt.boxplot(df.visit, notch=True)
{'whiskers': [<matplotlib.lines.Line2D at 0x7fbfbde1f610>,
  <matplotlib.lines.Line2D at 0x7fbfbde1f8e0>],
 'caps': [<matplotlib.lines.Line2D at 0x7fbfbde1fc70>,
  <matplotlib.lines.Line2D at 0x7fbfbde1fe80>],
 'boxes': [<matplotlib.lines.Line2D at 0x7fbfbde12220>],
 'medians': [<matplotlib.lines.Line2D at 0x7fbfbde3e190>],
 'fliers': [<matplotlib.lines.Line2D at 0x7fbfbde3e460>],
 'means': []}
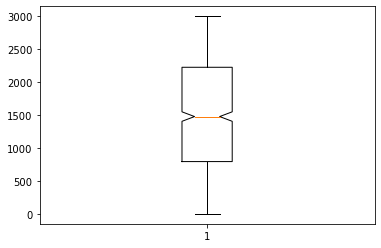
1# Abusing the fact the number of variables can be greater than the
2# number of replacement targets
3df1 = df[(df["visit"] <= 2900) & (df["visit"] >= 100)]
4print(
5    "After getting rid of outliers the new size of the data "
6    "is - {}".format(*df1.shape)
7)
After getting rid of outliers the new size of the data is - 923