

Wine quality#
The Red Wine Quality dataset consists of physiochemical measurements from about 1600 Portuguese red wines. Also included is a quality rating for each wine from blind taste-tests.
1raise SystemExit("Stop right there!");
An exception has occurred, use %tb to see the full traceback.

SystemExit: Stop right there!
Importing libraries and packages#
 1# System
 2import os
 3
 4# Mathematical operations and data manipulation
 5import pandas as pd
 6
 7# Modelling
 8import tensorflow as tf
 9from tensorflow import keras
10from tensorflow.keras import layers
11
12# Plotting
13import matplotlib.pyplot as plt
14
15%matplotlib inline
16
17# Suppress
18# 0 = all messages are logged (default behavior)
19# 1 = INFO messages are not printed
20# 2 = INFO and WARNING messages are not printed
21# 3 = INFO, WARNING, and ERROR messages are not printed
22os.environ["TF_CPP_MIN_LOG_LEVEL"] = "2"
Set paths#
1# Path to datasets directory
2data_path = "./datasets"
3# Path to assets directory (for saving results to)
4assets_path = "./assets"
Loading dataset#
1red_wine = pd.read_csv(f"{data_path}/winequality-red.csv")
2red_wine.head()
| fixed acidity | volatile acidity | citric acid | residual sugar | chlorides | free sulfur dioxide | total sulfur dioxide | density | pH | sulphates | alcohol | quality | |
|---|---|---|---|---|---|---|---|---|---|---|---|---|
| 0 | 7.4 | 0.70 | 0.00 | 1.9 | 0.076 | 11.0 | 34.0 | 0.9978 | 3.51 | 0.56 | 9.4 | 5 |
| 1 | 7.8 | 0.88 | 0.00 | 2.6 | 0.098 | 25.0 | 67.0 | 0.9968 | 3.20 | 0.68 | 9.8 | 5 |
| 2 | 7.8 | 0.76 | 0.04 | 2.3 | 0.092 | 15.0 | 54.0 | 0.9970 | 3.26 | 0.65 | 9.8 | 5 |
| 3 | 11.2 | 0.28 | 0.56 | 1.9 | 0.075 | 17.0 | 60.0 | 0.9980 | 3.16 | 0.58 | 9.8 | 6 |
| 4 | 7.4 | 0.70 | 0.00 | 1.9 | 0.076 | 11.0 | 34.0 | 0.9978 | 3.51 | 0.56 | 9.4 | 5 |
1red_wine.shape
(1599, 12)
Training of the network#
 1model = keras.Sequential([layers.Dense(units=1, input_shape=[11])])
 2
 3w, b = model.weights
 4print("Weights\n{}\n\nBias\n{}".format(w, b))
 5
 6# Plotting
 7plt.style.use("seaborn-whitegrid")
 8
 9# Set Matplotlib defaults
10plt.rc("figure", autolayout=True)
11plt.rc(
12    "axes",
13    labelweight="bold",
14    labelsize="large",
15    titleweight="bold",
16    titlesize=18,
17    titlepad=10,
18)
Weights
<tf.Variable 'dense/kernel:0' shape=(11, 1) dtype=float32, numpy=
array([[-0.23026964],
       [ 0.4494403 ],
       [-0.18951398],
       [ 0.19517463],
       [-0.45655268],
       [-0.08020645],
       [ 0.16509748],
       [-0.15993416],
       [ 0.13550514],
       [ 0.12772518],
       [-0.33042252]], dtype=float32)>

Bias
<tf.Variable 'dense/bias:0' shape=(1,) dtype=float32, numpy=array([0.], dtype=float32)>
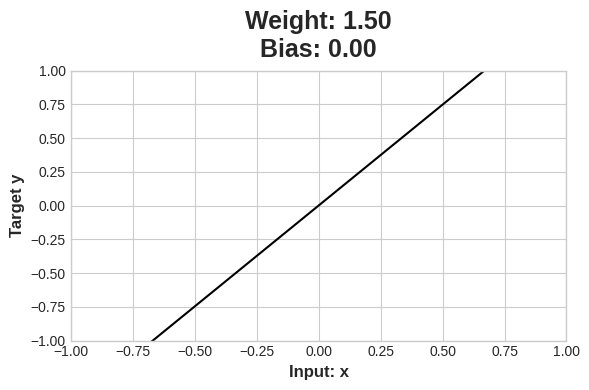
 1# Plotting an untrained model
 2model = keras.Sequential(
 3    [
 4        layers.Dense(1, input_shape=[1]),
 5    ]
 6)
 7
 8x = tf.linspace(-1.0, 1.0, 100)
 9y = model.predict(x)
10
11plt.figure(dpi=100)
12plt.plot(x, y, "k")
13plt.xlim(-1, 1)
14plt.ylim(-1, 1)
15plt.xlabel("Input: x")
16plt.ylabel("Target y")
17w, b = model.weights  # you could also use model.get_weights() here
18plt.title("Weight: {:0.2f}\nBias: {:0.2f}".format(w[0][0], b[0]))
19plt.show()
 1# Plotting
 2plt.style.use("seaborn-whitegrid")
 3
 4# Set Matplotlib defaults
 5plt.rc("figure", autolayout=True)
 6plt.rc(
 7    "axes",
 8    labelweight="bold",
 9    labelsize="large",
10    titleweight="bold",
11    titlesize=18,
12    titlepad=10,
13)
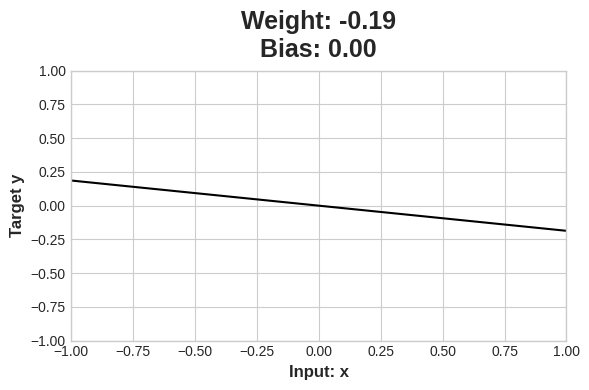
 1# Plotting an untrained model
 2model = keras.Sequential(
 3    [
 4        layers.Dense(1, input_shape=[1]),
 5    ]
 6)
 7
 8x = tf.linspace(-1.0, 1.0, 100)
 9y = model.predict(x)
10
11plt.figure(dpi=100)
12plt.plot(x, y, "k")
13plt.xlim(-1, 1)
14plt.ylim(-1, 1)
15plt.xlabel("Input: x")
16plt.ylabel("Target y")
17w, b = model.weights  # you could also use model.get_weights() here
18plt.title("Weight: {:0.2f}\nBias: {:0.2f}".format(w[0][0], b[0]))
19plt.show()