

Ames Housing Scoring New Data#
Let’s imagine that a colleague asks for scoring the latest data to make sure the chosen Lasso Regression model is working appropriately.
This is one potential solution and certainly not optimal.
 1# to handle datasets
 2import pandas as pd
 3import numpy as np
 4
 5# for the yeo-johnson transformation
 6import scipy.stats as stats
 7
 8# to save the model
 9import joblib
10
11# Warnings
12import warnings
13
14warnings.filterwarnings("ignore")
Paths#
1# Path to datasets directory
2data_path = "./datasets"
3# Path to assets directory (for saving results to)
4assets_path = "./assets"
Loading the datasets#
1# load the unseen / new dataset
2data = pd.read_csv(f"{data_path}/test.csv")
3
4# rows and columns of the data
5print(data.shape)
6
7# visualising the dataset
8data.head()
(1459, 80)
| Id | MSSubClass | MSZoning | LotFrontage | LotArea | Street | Alley | LotShape | LandContour | Utilities | ... | ScreenPorch | PoolArea | PoolQC | Fence | MiscFeature | MiscVal | MoSold | YrSold | SaleType | SaleCondition | |
|---|---|---|---|---|---|---|---|---|---|---|---|---|---|---|---|---|---|---|---|---|---|
| 0 | 1461 | 20 | RH | 80.0 | 11622 | Pave | NaN | Reg | Lvl | AllPub | ... | 120 | 0 | NaN | MnPrv | NaN | 0 | 6 | 2010 | WD | Normal |
| 1 | 1462 | 20 | RL | 81.0 | 14267 | Pave | NaN | IR1 | Lvl | AllPub | ... | 0 | 0 | NaN | NaN | Gar2 | 12500 | 6 | 2010 | WD | Normal |
| 2 | 1463 | 60 | RL | 74.0 | 13830 | Pave | NaN | IR1 | Lvl | AllPub | ... | 0 | 0 | NaN | MnPrv | NaN | 0 | 3 | 2010 | WD | Normal |
| 3 | 1464 | 60 | RL | 78.0 | 9978 | Pave | NaN | IR1 | Lvl | AllPub | ... | 0 | 0 | NaN | NaN | NaN | 0 | 6 | 2010 | WD | Normal |
| 4 | 1465 | 120 | RL | 43.0 | 5005 | Pave | NaN | IR1 | HLS | AllPub | ... | 144 | 0 | NaN | NaN | NaN | 0 | 1 | 2010 | WD | Normal |
5 rows × 80 columns
1# dropping the id variable
2data.drop("Id", axis=1, inplace=True)
3data.shape
(1459, 79)
Feature Engineering#
The list of transformations done during the Feature Engineering of the training set were:
Missing values
Temporal variables
Non-Gaussian distributed variables
Categorical variables: remove rare labels
Categorical variables: convert strings to numbers
Put the variables in a similar scale
Missing values#
Categorical variables#
Replace missing values with the string “missing” in those variables with a lot of missing data.
Replace missing data with the most frequent category in those variables that contain fewer observations without values.
1# first we needed to cast MSSubClass as object
2data["MSSubClass"] = data["MSSubClass"].astype("O")
 1# list of different groups of categorical variables
 2with_string_missing = [
 3    "Alley",
 4    "FireplaceQu",
 5    "PoolQC",
 6    "Fence",
 7    "MiscFeature",
 8]
 9
10# ==================
11# copy this dictionary from the Feature-engineering notebook
12# we needed to hard-code this by hand
13# the key is the variable and the value is its most frequent category
14# what if the model is retrained and the below values change?
15# ==================
16
17with_frequent_category = {
18    "MasVnrType": "None",
19    "BsmtQual": "TA",
20    "BsmtCond": "TA",
21    "BsmtExposure": "No",
22    "BsmtFinType1": "Unf",
23    "BsmtFinType2": "Unf",
24    "Electrical": "SBrkr",
25    "GarageType": "Attchd",
26    "GarageFinish": "Unf",
27    "GarageQual": "TA",
28    "GarageCond": "TA",
29}
1# replacing missing values with new label: "Missing"
2data[with_string_missing] = data[with_string_missing].fillna("Missing")
1# replacing missing values with the most frequent category
2for var in with_frequent_category.keys():
3    data[var].fillna(with_frequent_category[var], inplace=True)
Numerical variables#
To engineer missing values in numerical variables, we will:
add a binary missing value indicator variable
and then replace the missing values in the original variable with the mean
 1# this is the dictionary of numerical variable with missing data
 2# and its mean, as determined from the training set in the
 3# Feature Engineering notebook
 4# note how we needed to hard code the values
 5
 6vars_with_na = {
 7    "LotFrontage": 69.87974098057354,
 8    "MasVnrArea": 103.7974006116208,
 9    "GarageYrBlt": 1978.2959677419356,
10}
 1# replacing missing values
 2
 3for var in vars_with_na.keys():
 4
 5    # add binary missing indicator (in train and test)
 6    data[var + "_na"] = np.where(data[var].isnull(), 1, 0)
 7
 8    # replace missing values by the mean
 9    # (in train and test)
10    data[var].fillna(vars_with_na[var], inplace=True)
11
12data[vars_with_na].isnull().sum()
LotFrontage    0
MasVnrArea     0
GarageYrBlt    0
dtype: int64
1# check the binary missing indicator variables
2data[["LotFrontage_na", "MasVnrArea_na", "GarageYrBlt_na"]].head()
| LotFrontage_na | MasVnrArea_na | GarageYrBlt_na | |
|---|---|---|---|
| 0 | 0 | 0 | 0 |
| 1 | 0 | 0 | 0 |
| 2 | 0 | 0 | 0 |
| 3 | 0 | 0 | 0 |
| 4 | 0 | 0 | 0 |
Temporal variables#
Capture elapsed time#
The time elapsed between those variables and the year in which the house was sold:
1def elapsed_years(df, variable):
2    # capture difference between the year variable
3    # and the year in which the house was sold
4    df[variable] = df["YrSold"] - df[variable]
5    return df
1for var in ["YearBuilt", "YearRemodAdd", "GarageYrBlt"]:
2    data = elapsed_years(data, var)
1# now drop YrSold
2data.drop(["YrSold"], axis=1, inplace=True)
Numerical variable transformation#
Logarithmic transformation#
Transform the positive numerical variables with the logarithm in order to get a more Gaussian-like distribution.
1for var in ["LotFrontage", "1stFlrSF", "GrLivArea"]:
2    data[var] = np.log(data[var])
Yeo-Johnson transformation#
Applying the Yeo-Johnson transformation to LotArea.
1# note how we use the lambda that we learned from the train set
2# in the notebook on Feature Engineering.
3# Note that we need to hard code this value
4data["LotArea"] = stats.yeojohnson(data["LotArea"], lmbda=-12.55283001172003)
Binarize skewed variables#
There were a few variables very skewed, we would transform those into binary variables.
 1skewed = [
 2    "BsmtFinSF2",
 3    "LowQualFinSF",
 4    "EnclosedPorch",
 5    "3SsnPorch",
 6    "ScreenPorch",
 7    "MiscVal",
 8]
 9
10for var in skewed:
11
12    # map the variable values into 0 and 1
13    data[var] = np.where(data[var] == 0, 0, 1)
Categorical variables#
Apply mappings#
Remapping variables with specific meanings into a numerical scale.
 1# re-mapping strings to number, which determine quality
 2qual_mappings = {
 3    "Po": 1,
 4    "Fa": 2,
 5    "TA": 3,
 6    "Gd": 4,
 7    "Ex": 5,
 8    "Missing": 0,
 9    "NA": 0,
10}
11
12qual_vars = [
13    "ExterQual",
14    "ExterCond",
15    "BsmtQual",
16    "BsmtCond",
17    "HeatingQC",
18    "KitchenQual",
19    "FireplaceQu",
20    "GarageQual",
21    "GarageCond",
22]
23
24for var in qual_vars:
25    data[var] = data[var].map(qual_mappings)
1exposure_mappings = {"No": 1, "Mn": 2, "Av": 3, "Gd": 4}
2
3var = "BsmtExposure"
4
5data[var] = data[var].map(exposure_mappings)
 1finish_mappings = {
 2    "Missing": 0,
 3    "NA": 0,
 4    "Unf": 1,
 5    "LwQ": 2,
 6    "Rec": 3,
 7    "BLQ": 4,
 8    "ALQ": 5,
 9    "GLQ": 6,
10}
11
12finish_vars = ["BsmtFinType1", "BsmtFinType2"]
13
14for var in finish_vars:
15    data[var] = data[var].map(finish_mappings)
1garage_mappings = {"Missing": 0, "NA": 0, "Unf": 1, "RFn": 2, "Fin": 3}
2
3var = "GarageFinish"
4data[var] = data[var].map(garage_mappings)
 1fence_mappings = {
 2    "Missing": 0,
 3    "NA": 0,
 4    "MnWw": 1,
 5    "GdWo": 2,
 6    "MnPrv": 3,
 7    "GdPrv": 4,
 8}
 9
10var = "Fence"
11data[var] = data[var].map(fence_mappings)
1# check absence of na in the data set
2with_null = [var for var in data.columns if data[var].isnull().sum() > 0]
3
4with_null
['MSZoning',
 'Utilities',
 'Exterior1st',
 'Exterior2nd',
 'BsmtFinSF1',
 'BsmtUnfSF',
 'TotalBsmtSF',
 'BsmtFullBath',
 'BsmtHalfBath',
 'KitchenQual',
 'Functional',
 'GarageCars',
 'GarageArea',
 'SaleType']
Surprise
There are quite a few variables with missing data!!
 1# did those have missing data in the train set?
 2
 3[
 4    var
 5    for var in with_null
 6    if var
 7    in list(with_frequent_category.keys())
 8    + with_string_missing
 9    + list(vars_with_na.keys())
10]
[]
IMPORTANT
In the new data, we have a bunch of variables that contain missing information, that was not anticipated.
Removing Rare Labels#
For the remaining categorical variables, we will group those categories that are present in less than 1% of the observations into a “Rare” string.
 1# create a dictionary with the most frequent categories per variable
 2
 3# note the amount of hard coding. Perhaps use a numpy pickle in the
 4# Feature Engineering notebook and load it here, instead of hard-coding.
 5
 6frequent_ls = {
 7    "MSZoning": ["FV", "RH", "RL", "RM"],
 8    "Street": ["Pave"],
 9    "Alley": ["Grvl", "Missing", "Pave"],
10    "LotShape": ["IR1", "IR2", "Reg"],
11    "LandContour": ["Bnk", "HLS", "Low", "Lvl"],
12    "Utilities": ["AllPub"],
13    "LotConfig": ["Corner", "CulDSac", "FR2", "Inside"],
14    "LandSlope": ["Gtl", "Mod"],
15    "Neighborhood": [
16        "Blmngtn",
17        "BrDale",
18        "BrkSide",
19        "ClearCr",
20        "CollgCr",
21        "Crawfor",
22        "Edwards",
23        "Gilbert",
24        "IDOTRR",
25        "MeadowV",
26        "Mitchel",
27        "NAmes",
28        "NWAmes",
29        "NoRidge",
30        "NridgHt",
31        "OldTown",
32        "SWISU",
33        "Sawyer",
34        "SawyerW",
35        "Somerst",
36        "StoneBr",
37        "Timber",
38    ],
39    "Condition1": ["Artery", "Feedr", "Norm", "PosN", "RRAn"],
40    "Condition2": ["Norm"],
41    "BldgType": ["1Fam", "2fmCon", "Duplex", "Twnhs", "TwnhsE"],
42    "HouseStyle": ["1.5Fin", "1Story", "2Story", "SFoyer", "SLvl"],
43    "RoofStyle": ["Gable", "Hip"],
44    "RoofMatl": ["CompShg"],
45    "Exterior1st": [
46        "AsbShng",
47        "BrkFace",
48        "CemntBd",
49        "HdBoard",
50        "MetalSd",
51        "Plywood",
52        "Stucco",
53        "VinylSd",
54        "Wd Sdng",
55        "WdShing",
56    ],
57    "Exterior2nd": [
58        "AsbShng",
59        "BrkFace",
60        "CmentBd",
61        "HdBoard",
62        "MetalSd",
63        "Plywood",
64        "Stucco",
65        "VinylSd",
66        "Wd Sdng",
67        "Wd Shng",
68    ],
69    "MasVnrType": ["BrkFace", "None", "Stone"],
70    "Foundation": ["BrkTil", "CBlock", "PConc", "Slab"],
71    "Heating": ["GasA", "GasW"],
72    "CentralAir": ["N", "Y"],
73    "Electrical": ["FuseA", "FuseF", "SBrkr"],
74    "Functional": ["Min1", "Min2", "Mod", "Typ"],
75    "GarageType": ["Attchd", "Basment", "BuiltIn", "Detchd"],
76    "PavedDrive": ["N", "P", "Y"],
77    "PoolQC": ["Missing"],
78    "MiscFeature": ["Missing", "Shed"],
79    "SaleType": ["COD", "New", "WD"],
80    "SaleCondition": ["Abnorml", "Family", "Normal", "Partial"],
81    "MSSubClass": [
82        "20",
83        "30",
84        "50",
85        "60",
86        "70",
87        "75",
88        "80",
89        "85",
90        "90",
91        "120",
92        "160",
93        "190",
94    ],
95}
1for var in frequent_ls.keys():
2
3    # replace rare categories by the string "Rare"
4    data[var] = np.where(data[var].isin(frequent_ls), data[var], "Rare")
Encoding of categorical variables#
Transform the strings of the categorical variables into numbers.
  1# The mappings learned from the train set are needed. Otherwise,
  2# the model is going to produce inaccurate results
  3
  4# note the amount of hard coding that we need to do. That numpy pickle?
  5
  6ordinal_mappings = {
  7    "MSZoning": {"Rare": 0, "RM": 1, "RH": 2, "RL": 3, "FV": 4},
  8    "Street": {"Rare": 0, "Pave": 1},
  9    "Alley": {"Grvl": 0, "Pave": 1, "Missing": 2},
 10    "LotShape": {"Reg": 0, "IR1": 1, "Rare": 2, "IR2": 3},
 11    "LandContour": {"Bnk": 0, "Lvl": 1, "Low": 2, "HLS": 3},
 12    "Utilities": {"Rare": 0, "AllPub": 1},
 13    "LotConfig": {"Inside": 0, "FR2": 1, "Corner": 2, "Rare": 3, "CulDSac": 4},
 14    "LandSlope": {"Gtl": 0, "Mod": 1, "Rare": 2},
 15    "Neighborhood": {
 16        "IDOTRR": 0,
 17        "MeadowV": 1,
 18        "BrDale": 2,
 19        "Edwards": 3,
 20        "BrkSide": 4,
 21        "OldTown": 5,
 22        "Sawyer": 6,
 23        "SWISU": 7,
 24        "NAmes": 8,
 25        "Mitchel": 9,
 26        "SawyerW": 10,
 27        "Rare": 11,
 28        "NWAmes": 12,
 29        "Gilbert": 13,
 30        "Blmngtn": 14,
 31        "CollgCr": 15,
 32        "Crawfor": 16,
 33        "ClearCr": 17,
 34        "Somerst": 18,
 35        "Timber": 19,
 36        "StoneBr": 20,
 37        "NridgHt": 21,
 38        "NoRidge": 22,
 39    },
 40    "Condition1": {
 41        "Artery": 0,
 42        "Feedr": 1,
 43        "Norm": 2,
 44        "RRAn": 3,
 45        "Rare": 4,
 46        "PosN": 5,
 47    },
 48    "Condition2": {"Rare": 0, "Norm": 1},
 49    "BldgType": {"2fmCon": 0, "Duplex": 1, "Twnhs": 2, "1Fam": 3, "TwnhsE": 4},
 50    "HouseStyle": {
 51        "SFoyer": 0,
 52        "1.5Fin": 1,
 53        "Rare": 2,
 54        "1Story": 3,
 55        "SLvl": 4,
 56        "2Story": 5,
 57    },
 58    "RoofStyle": {"Gable": 0, "Rare": 1, "Hip": 2},
 59    "RoofMatl": {"CompShg": 0, "Rare": 1},
 60    "Exterior1st": {
 61        "AsbShng": 0,
 62        "Wd Sdng": 1,
 63        "WdShing": 2,
 64        "MetalSd": 3,
 65        "Stucco": 4,
 66        "Rare": 5,
 67        "HdBoard": 6,
 68        "Plywood": 7,
 69        "BrkFace": 8,
 70        "CemntBd": 9,
 71        "VinylSd": 10,
 72    },
 73    "Exterior2nd": {
 74        "AsbShng": 0,
 75        "Wd Sdng": 1,
 76        "MetalSd": 2,
 77        "Wd Shng": 3,
 78        "Stucco": 4,
 79        "Rare": 5,
 80        "HdBoard": 6,
 81        "Plywood": 7,
 82        "BrkFace": 8,
 83        "CmentBd": 9,
 84        "VinylSd": 10,
 85    },
 86    "MasVnrType": {"Rare": 0, "None": 1, "BrkFace": 2, "Stone": 3},
 87    "Foundation": {"Slab": 0, "BrkTil": 1, "CBlock": 2, "Rare": 3, "PConc": 4},
 88    "Heating": {"Rare": 0, "GasW": 1, "GasA": 2},
 89    "CentralAir": {"N": 0, "Y": 1},
 90    "Electrical": {"Rare": 0, "FuseF": 1, "FuseA": 2, "SBrkr": 3},
 91    "Functional": {"Rare": 0, "Min2": 1, "Mod": 2, "Min1": 3, "Typ": 4},
 92    "GarageType": {
 93        "Rare": 0,
 94        "Detchd": 1,
 95        "Basment": 2,
 96        "Attchd": 3,
 97        "BuiltIn": 4,
 98    },
 99    "PavedDrive": {"N": 0, "P": 1, "Y": 2},
100    "PoolQC": {"Missing": 0, "Rare": 1},
101    "MiscFeature": {"Rare": 0, "Shed": 1, "Missing": 2},
102    "SaleType": {"COD": 0, "Rare": 1, "WD": 2, "New": 3},
103    "SaleCondition": {
104        "Rare": 0,
105        "Abnorml": 1,
106        "Family": 2,
107        "Normal": 3,
108        "Partial": 4,
109    },
110    "MSSubClass": {
111        "30": 0,
112        "Rare": 1,
113        "190": 2,
114        "90": 3,
115        "160": 4,
116        "50": 5,
117        "85": 6,
118        "70": 7,
119        "80": 8,
120        "20": 9,
121        "75": 10,
122        "120": 11,
123        "60": 12,
124    },
125}
1for var in ordinal_mappings.keys():
2
3    ordinal_label = ordinal_mappings[var]
4    # use the dictionary to replace the categorical strings by integers
5    data[var] = data[var].map(ordinal_label)
1# check absence of na in the data set
2
3with_null = [var for var in data.columns if data[var].isnull().sum() > 0]
4len(with_null)
13
1# there is missing data in a lot of the variables.
2
3# Unfortunately, the scaler wil not work with missing data, so
4# those values need to be filled
5
6# in the real world, we would try to understand where they are coming from
7# and why they were not present in the training set
8
9data.fillna(0, inplace=True)
Feature Scaling#
Scale features to the minimum and maximum values:
1# load the scaler we saved in the notebook on Feature Engineering
2
3# fortunataly, it was saved, but this is easy to forget
4
5scaler = joblib.load(f"{data_path}/minmax_scaler.joblib")
6
7data = pd.DataFrame(scaler.transform(data), columns=data.columns)
1data.head()
| MSSubClass | MSZoning | LotFrontage | LotArea | Street | Alley | LotShape | LandContour | Utilities | LotConfig | ... | PoolQC | Fence | MiscFeature | MiscVal | MoSold | SaleType | SaleCondition | LotFrontage_na | MasVnrArea_na | GarageYrBlt_na | |
|---|---|---|---|---|---|---|---|---|---|---|---|---|---|---|---|---|---|---|---|---|---|
| 0 | 0.083333 | 0.0 | 0.495064 | -1.246003 | 0.0 | 0.0 | 0.666667 | 0.0 | 0.0 | 0.75 | ... | 1.0 | 0.75 | 0.0 | 0.0 | 0.454545 | 0.333333 | 0.0 | 0.0 | 0.0 | 0.0 |
| 1 | 0.083333 | 0.0 | 0.499662 | -1.246003 | 0.0 | 0.0 | 0.666667 | 0.0 | 0.0 | 0.75 | ... | 1.0 | 0.00 | 0.0 | 1.0 | 0.454545 | 0.333333 | 0.0 | 0.0 | 0.0 | 0.0 |
| 2 | 0.083333 | 0.0 | 0.466207 | -1.246003 | 0.0 | 0.0 | 0.666667 | 0.0 | 0.0 | 0.75 | ... | 1.0 | 0.75 | 0.0 | 0.0 | 0.181818 | 0.333333 | 0.0 | 0.0 | 0.0 | 0.0 |
| 3 | 0.083333 | 0.0 | 0.485693 | -1.246003 | 0.0 | 0.0 | 0.666667 | 0.0 | 0.0 | 0.75 | ... | 1.0 | 0.00 | 0.0 | 0.0 | 0.454545 | 0.333333 | 0.0 | 0.0 | 0.0 | 0.0 |
| 4 | 0.083333 | 0.0 | 0.265271 | -1.246003 | 0.0 | 0.0 | 0.666667 | 0.0 | 0.0 | 0.75 | ... | 1.0 | 0.00 | 0.0 | 0.0 | 0.000000 | 0.333333 | 0.0 | 0.0 | 0.0 | 0.0 |
5 rows × 81 columns
1# load the pre-selected features
2# ==============================
3features = pd.read_csv(f"{data_path}/selected_features.csv")
4features = features["0"].to_list()
5
6# reduce the train and test set to the selected features
7data = data[features]
8data.shape
(1459, 36)
Note that we engineered so many variables, when we are actually going to feed only 31 to the model.
We could have, of course, engineered only the variables that we are going to use in the model. But that means:
identifying which variables are needed
identifying which transformation per variable re needed
redefining dictionaries accordingly
retraining the MinMaxScaler only on the selected variables (at the moment, it is trained on the entire dataset)
That means extra code to train the scaler only on the selected variables. Probably removing the scaler from the Feature Engineering notebook and passing it onto the Feature Selection notebook.
We need to be really careful in re-writing the code here to make sure we do not forget or engineer wrongly any of the variables.
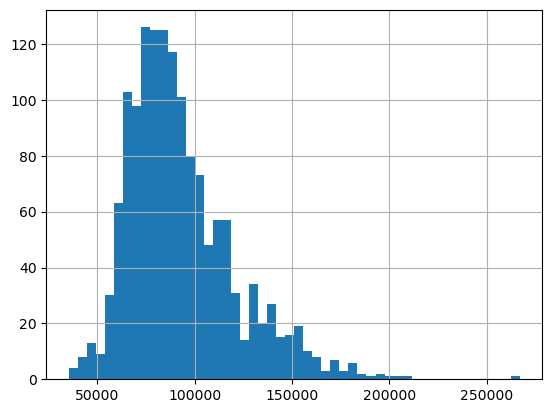
1# now load the trained model
2lin_model = joblib.load(f"{data_path}/linear_regression.joblib")
3
4# obtain the predictions
5pred = lin_model.predict(data)
6
7# plot the predicted sale prices
8pd.Series(np.exp(pred)).hist(bins=50)
<AxesSubplot: >
List of problems#
re-writing a lot of code ==> repetitive
hard coding a lot of parameters ==> if these change they need to bere-written again
engineering a lot of variables that are not needed for the model
additional variables present missing data, unclear what to do with them