Mean-shift clustering#
Mean-Shift is a density-based models: These models define clusters by their density in the data space. Areas with a high density of data points will become clusters, which are typically separated from one another by low-density areas.
The algorithm works by modeling the data points as a distribution function, where high-density areas (high concentration of data points) represent high peaks. Then, the general idea is to shift each data point until it reaches its nearest peak, which becomes a cluster.
Importing libraries and packages#
 1# Mathematical operations and data manipulation
 2import pandas as pd
 3
 4# Model
 5from sklearn.cluster import MeanShift
 6from sklearn.metrics import silhouette_score
 7from sklearn.metrics import calinski_harabasz_score
 8
 9# Plotting
10import matplotlib.pyplot as plt
11
12# Warnings
13import warnings
14
15warnings.filterwarnings("ignore")
16
17%matplotlib inline
Set paths#
1# Path to datasets directory
2data_path = "./datasets"
3# Path to assets directory (for saving results to)
4assets_path = "./assets"
Loading dataset#
1dataset = pd.read_csv(f"{data_path}/circles.csv")
Exploring dataset#
1# Shape of the dataset
2print("Shape of the dataset: ", dataset.shape)
3# Head
4dataset
Shape of the dataset: (1500, 2)
| 0 | 1 | |
|---|---|---|
| 0 | 0.393992 | -0.416376 |
| 1 | 0.528243 | -0.828242 |
| 2 | -0.740158 | 0.607730 |
| 3 | -0.971016 | 0.316821 |
| 4 | 0.018693 | -0.605288 |
| ... | ... | ... |
| 1495 | 0.085197 | -0.463028 |
| 1496 | 0.890820 | 0.003483 |
| 1497 | 0.223768 | -0.419122 |
| 1498 | 0.221189 | -0.510314 |
| 1499 | 0.544376 | 0.049358 |
1500 rows × 2 columns
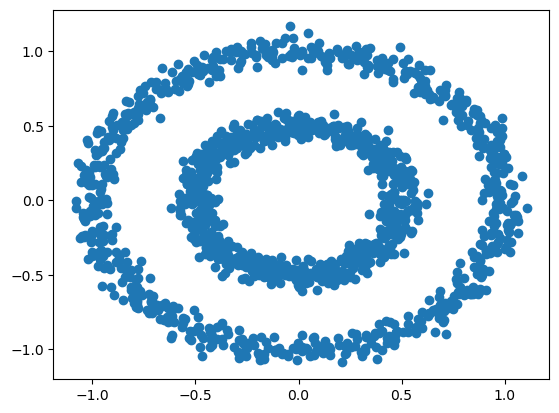
1plt.scatter(dataset.iloc[:, 0], dataset.iloc[:, 1])
2plt.show()
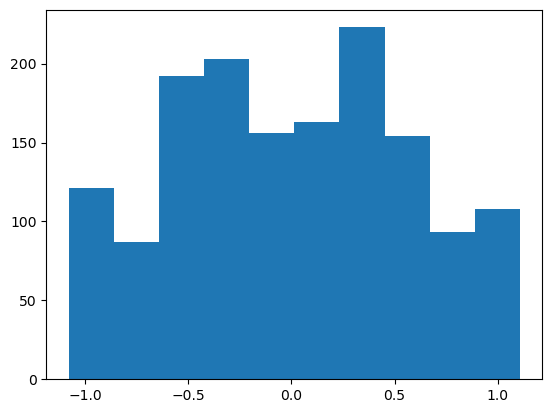
1# Using slicing to select the feature
2plt.hist(dataset.iloc[:, 0])
3plt.show()
<a id=”mean-shift>
Mean-Shift#
1# The mean-shift algorithm does not the number of clusters specified.
2# Bandwith can be fine-tuned to get the best performance. Train the
3# model with a bandwidth of 0.5 - chosen after trying out 0.1 and 0.9.
4est_meanshift = MeanShift(bandwidth=0.5)
5# Fit to the data
6est_meanshift.fit(dataset)
7# Using the model to assign a cluster to each data point
8pred_meanshift = est_meanshift.predict(dataset)
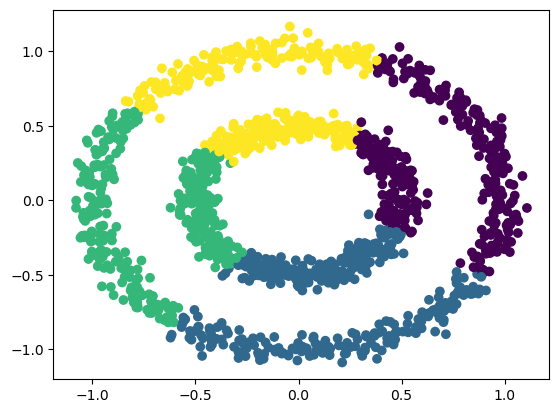
1# Plot the data points into clusters
2plt.scatter(dataset.iloc[:, 0], dataset.iloc[:, 1], c=pred_meanshift)
3plt.savefig(f"{assets_path}/circles-mean-shift.png", bbox_inches="tight")
4plt.show()
Metrics#
1# Silhouette
2meanshift_silhouette_score = silhouette_score(
3    dataset, pred_meanshift, metric="euclidean"
4)
5print(meanshift_silhouette_score)
0.3705351315933256
1# Calinski_harabasz
2meanshift_calinski_harabasz_score = calinski_harabasz_score(
3    dataset, pred_meanshift
4)
5print(meanshift_calinski_harabasz_score)
1305.1425653034062