

Predicting Survival on the Titanic#
The RMS Titanic was known as the unsinkable ship and was the largest, most luxurious passenger ship of its time. Sadly, the British ocean liner sank on April 15, 1912, killing 1502 out of 2224 people on board.
by analysing the probability of survival based on few attributes like gender, age, and social status, we can make very accurate predictions on which passengers would survive. Some groups of people were more likely to survive than others, such as women, children, and the upper-class. Therefore, we can learn about the society priorities and privileges at the time.
For more on the titanic, see https://www.encyclopedia-titanica.org/
We are using the original dataset: https://www.openml.org/search?type=data&status=active&id=40945
The data consists of demographic and traveling information for 1,309 of the Titanic passengers, and the goal is to build a Machine Learning Pipeline, to engineer the features in the data set and predict who is more likely to Survive the catastrophe.
 1import re
 2
 3# Mathematical operations and data manipulation
 4import pandas as pd
 5import numpy as np
 6
 7# Plotting
 8import matplotlib.pyplot as plt
 9
10# to divide train and test set
11from sklearn.model_selection import train_test_split
12
13# feature scaling
14from sklearn.preprocessing import StandardScaler
15
16# to build the models
17from sklearn.linear_model import LogisticRegression
18
19# to evaluate the models
20from sklearn.metrics import accuracy_score, roc_auc_score
21
22# to persist the model and the scaler
23import joblib
24
25# to visualise al the columns in the dataframe
26pd.pandas.set_option("display.max_columns", None)
Paths#
1# Path to datasets directory
2data_path = "./datasets"
3# Path to assets directory (for saving results to)
4assets_path = "./assets"
Prepare the data set#
1# Load the data - it is available open source and online
2data = pd.read_csv("https://www.openml.org/data/get_csv/16826755/phpMYEkMl")
3
4data.head()
| pclass | survived | name | sex | age | sibsp | parch | ticket | fare | cabin | embarked | boat | body | home.dest | |
|---|---|---|---|---|---|---|---|---|---|---|---|---|---|---|
| 0 | 1 | 1 | Allen, Miss. Elisabeth Walton | female | 29 | 0 | 0 | 24160 | 211.3375 | B5 | S | 2 | ? | St Louis, MO |
| 1 | 1 | 1 | Allison, Master. Hudson Trevor | male | 0.9167 | 1 | 2 | 113781 | 151.55 | C22 C26 | S | 11 | ? | Montreal, PQ / Chesterville, ON |
| 2 | 1 | 0 | Allison, Miss. Helen Loraine | female | 2 | 1 | 2 | 113781 | 151.55 | C22 C26 | S | ? | ? | Montreal, PQ / Chesterville, ON |
| 3 | 1 | 0 | Allison, Mr. Hudson Joshua Creighton | male | 30 | 1 | 2 | 113781 | 151.55 | C22 C26 | S | ? | 135 | Montreal, PQ / Chesterville, ON |
| 4 | 1 | 0 | Allison, Mrs. Hudson J C (Bessie Waldo Daniels) | female | 25 | 1 | 2 | 113781 | 151.55 | C22 C26 | S | ? | ? | Montreal, PQ / Chesterville, ON |
1# Replace interrogation marks by NaN values
2data = data.replace("?", np.nan)
1# retain only the first cabin if more than 1 are available per passenger
2def get_first_cabin(row):
3    try:
4        return row.split()[0]
5    except:
6        return np.nan
7
8
9data["cabin"] = data["cabin"].apply(get_first_cabin)
 1# extracts the title (Mr, Ms, etc.) from the name variable
 2def get_title(passenger):
 3    line = passenger
 4    if re.search("Mrs", line):
 5        return "Mrs"
 6    elif re.search("Mr", line):
 7        return "Mr"
 8    elif re.search("Miss", line):
 9        return "Miss"
10    elif re.search("Master", line):
11        return "Master"
12    else:
13        return "Other"
14
15
16data["title"] = data["name"].apply(get_title)
1# cast numerical variables as floats
2data["fare"] = data["fare"].astype("float")
3data["age"] = data["age"].astype("float")
1# drop unnecessary variables
2data.drop(
3    labels=["name", "ticket", "boat", "body", "home.dest"],
4    axis=1,
5    inplace=True,
6)
7
8# display data
9data.head()
| pclass | survived | sex | age | sibsp | parch | fare | cabin | embarked | title | |
|---|---|---|---|---|---|---|---|---|---|---|
| 0 | 1 | 1 | female | 29.0000 | 0 | 0 | 211.3375 | B5 | S | Miss |
| 1 | 1 | 1 | male | 0.9167 | 1 | 2 | 151.5500 | C22 | S | Master |
| 2 | 1 | 0 | female | 2.0000 | 1 | 2 | 151.5500 | C22 | S | Miss |
| 3 | 1 | 0 | male | 30.0000 | 1 | 2 | 151.5500 | C22 | S | Mr |
| 4 | 1 | 0 | female | 25.0000 | 1 | 2 | 151.5500 | C22 | S | Mrs |
1# save the data set
2data.to_csv(f"{data_path}/titanic.csv", index=False)
Data Exploration#
Find numerical and categorical variables#
1target = "survived"
1vars_cat = [var for var in data.columns if data[var].dtype == "O"]
2
3vars_num = [
4    var for var in data.columns if var not in vars_cat and var != "survived"
5]
6
7print("Number of numerical variables: {}".format(len(vars_num)))
8print("Number of categorical variables: {}".format(len(vars_cat)))
Number of numerical variables: 5
Number of categorical variables: 4
Find missing values in variables#
1vars_with_na = [var for var in data.columns if data[var].isnull().sum() > 0]
1# first in numerical variables
2num_na = [var for var in vars_num if var in vars_with_na]
3print("Number of categorical variables with na: ", len(num_na))
Number of categorical variables with na: 2
1# now in categorical variables
2cat_na = [var for var in vars_cat if var in vars_with_na]
3print("Number of categorical variables with na: ", len(cat_na))
Number of categorical variables with na: 2
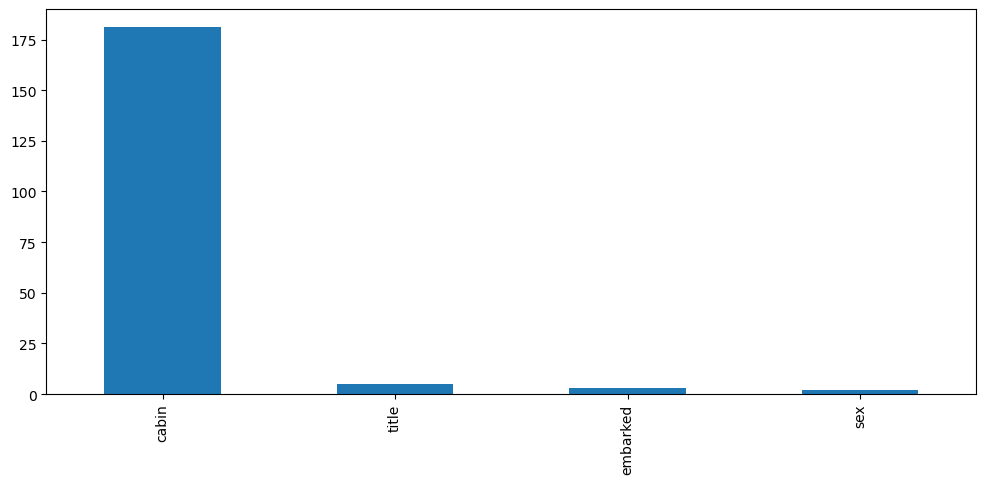
Determine cardinality of categorical variables#
1data[vars_cat].nunique().sort_values(ascending=False).plot.bar(figsize=(12, 5))
<AxesSubplot: >
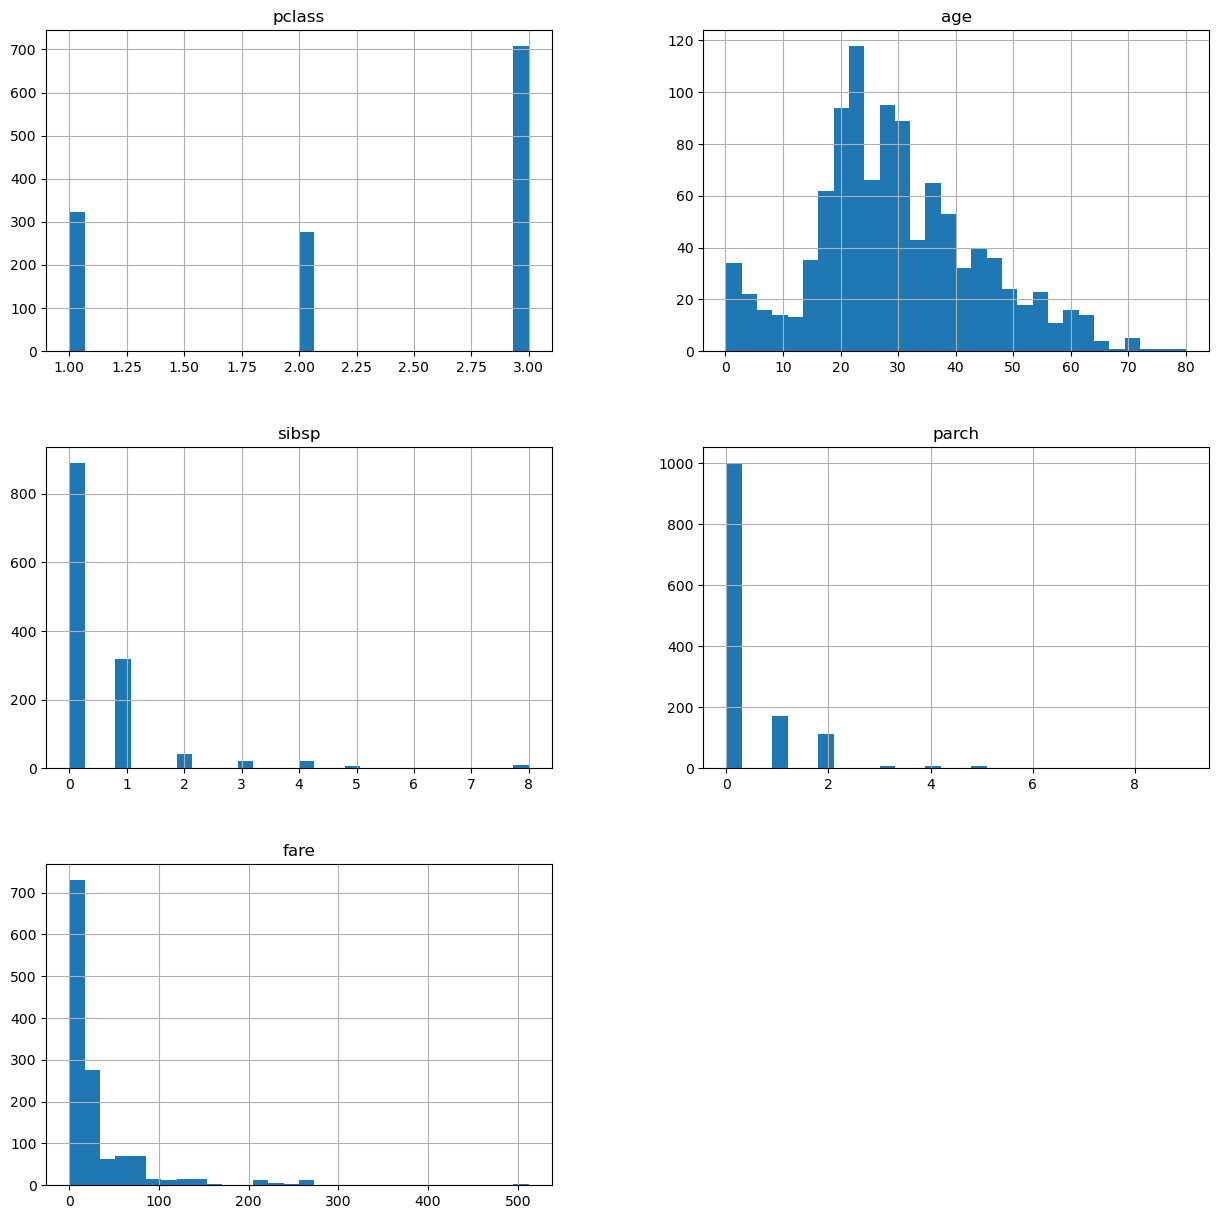
Determine the distribution of numerical variables#
1data[vars_num].hist(bins=30, figsize=(15, 15))
2plt.show()
Separate data into train and test#
Use the code below for reproducibility. Don’t change it.
1X_train, X_test, y_train, y_test = train_test_split(
2    data.drop("survived", axis=1),  # predictors
3    data["survived"],  # target
4    test_size=0.2,  # percentage of obs in test set
5    random_state=0,
6)  # seed to ensure reproducibility
7
8X_train.shape, X_test.shape
((1047, 9), (262, 9))
Feature Engineering#
Extract only the letter (and drop the number) from the variable Cabin#
1X_train["cabin"] = X_train["cabin"].apply(
2    lambda s: s[0] if pd.notnull(s) else "M"
3)
4X_test["cabin"] = X_test["cabin"].apply(
5    lambda s: s[0] if pd.notnull(s) else "M"
6)
7print(X_train["cabin"].unique())
['M' 'E' 'F' 'A' 'C' 'D' 'B' 'T' 'G']
Fill in Missing data in numerical variables:#
Add a binary missing indicator
Fill NA in original variable with the median
1X_train[vars_num].info()
<class 'pandas.core.frame.DataFrame'>
Int64Index: 1047 entries, 1118 to 684
Data columns (total 5 columns):
 #   Column  Non-Null Count  Dtype
---  ------  --------------  -----
 0   pclass  1047 non-null   int64
 1   age     841 non-null    float64
 2   sibsp   1047 non-null   int64
 3   parch   1047 non-null   int64
 4   fare    1046 non-null   float64
dtypes: float64(2), int64(3)
memory usage: 49.1 KB
 1for var in vars_num:
 2
 3    X_train[var + "_NA"] = np.where(X_train[var].isnull(), 1, 0)
 4    X_test[var + "_NA"] = np.where(X_test[var].isnull(), 1, 0)
 5
 6    med_val_train = X_train[var].median()
 7    med_val_test = X_test[var].median()
 8
 9    X_train[var].fillna(med_val_train, inplace=True)
10    X_test[var].fillna(med_val_test, inplace=True)
11
12X_train[vars_num].isna().sum()
pclass    0
age       0
sibsp     0
parch     0
fare      0
dtype: int64
Replace Missing data in categorical variables with the string Missing#
1X_train[vars_cat] = X_train[vars_cat].fillna("Missing")
2X_test[vars_cat] = X_test[vars_cat].fillna("Missing")
1X_train.isna().mean()
pclass       0.0
sex          0.0
age          0.0
sibsp        0.0
parch        0.0
fare         0.0
cabin        0.0
embarked     0.0
title        0.0
pclass_NA    0.0
age_NA       0.0
sibsp_NA     0.0
parch_NA     0.0
fare_NA      0.0
dtype: float64
1X_test.isna().mean()
pclass       0.0
sex          0.0
age          0.0
sibsp        0.0
parch        0.0
fare         0.0
cabin        0.0
embarked     0.0
title        0.0
pclass_NA    0.0
age_NA       0.0
sibsp_NA     0.0
parch_NA     0.0
fare_NA      0.0
dtype: float64
Remove rare labels in categorical variables#
remove labels present in less than 5 % of the passengers
1X_train[vars_cat].nunique()
sex         2
cabin       9
embarked    4
title       5
dtype: int64
 1def find_mode_values(df, var, rare_percentage):
 2    df = df.copy()
 3    tmp = df.groupby(var)[var].count() / len(df)
 4    return tmp[tmp > rare_percentage].index
 5
 6
 7for var in vars_cat:
 8    freq_values1 = find_mode_values(X_train, var, 0.05)
 9    freq_values2 = find_mode_values(X_test, var, 0.05)
10    X_train[var] = np.where(
11        X_train[var].isin(freq_values1), X_train[var], "Rare"
12    )
13    X_test[var] = np.where(X_test[var].isin(freq_values2), X_test[var], "Rare")
1X_train[vars_cat].nunique()
sex         2
cabin       3
embarked    4
title       4
dtype: int64
1X_test[vars_cat].nunique()
sex         2
cabin       3
embarked    3
title       5
dtype: int64
Perform one hot encoding of categorical variables into k-1 binary variables#
k-1, means that if the variable contains 9 different categories, we create 8 different binary variables
Remember to drop the original categorical variable (the one with the strings) after the encoding
 1for var in vars_cat:
 2    X_train = pd.concat(
 3        [X_train, pd.get_dummies(X_train[var], prefix=var, drop_first=True)],
 4        axis=1,
 5    )
 6    X_test = pd.concat(
 7        [X_test, pd.get_dummies(X_test[var], prefix=var, drop_first=True)],
 8        axis=1,
 9    )
10
11X_train.drop(labels=vars_cat, axis=1, inplace=True)
12X_test.drop(labels=vars_cat, axis=1, inplace=True)
1X_test = X_test.drop(["title_Miss"], axis=1)
1X_test["embarked_Rare"] = 0
1variables = [c for c in X_train.columns]
2
3variables
['pclass',
 'age',
 'sibsp',
 'parch',
 'fare',
 'pclass_NA',
 'age_NA',
 'sibsp_NA',
 'parch_NA',
 'fare_NA',
 'sex_male',
 'cabin_M',
 'cabin_Rare',
 'embarked_Q',
 'embarked_Rare',
 'embarked_S',
 'title_Mr',
 'title_Mrs',
 'title_Rare']
Scale the variables#
Use the standard scaler from Scikit-learn
1scaled = StandardScaler()
2
3scaled.fit(X_train[variables])
4
5X_train = scaled.transform(X_train[variables])
6X_test = scaled.transform(X_test[variables])
Train the Logistic Regression model#
Set the regularization parameter to 0.0005
Set the seed to 0
1model = LogisticRegression(C=0.0005, random_state=0)
2
3model.fit(X_train, y_train)
LogisticRegression(C=0.0005, random_state=0)In a Jupyter environment, please rerun this cell to show the HTML representation or trust the notebook.
On GitHub, the HTML representation is unable to render, please try loading this page with nbviewer.org.
LogisticRegression(C=0.0005, random_state=0)
Make predictions and evaluate model performance#
Determine:
roc-auc - requires the probability of survival.
accuracy - requires the outcome 0, 1, referring to survived or not.
 1class_ = model.predict(X_train)
 2pred = model.predict_proba(X_train)[:, 1]
 3
 4print("train roc-auc: {}".format(roc_auc_score(y_train, pred)))
 5print("train mse: {}".format(accuracy_score(y_train, class_)))
 6print()
 7
 8class_ = model.predict(X_test)
 9pred = model.predict_proba(X_test)[:, 1]
10
11print("train roc-auc: {}".format(roc_auc_score(y_test, pred)))
12print("train mse: {}".format(accuracy_score(y_test, class_)))
train roc-auc: 0.8431723338485316
train mse: 0.7125119388729704

train roc-auc: 0.8355864197530863
train mse: 0.7022900763358778
1joblib.dump(model, f"{assets_path}/logistic_regression.joblib")
['./assets/logistic_regression.joblib']