
KMeans clustering#
KMeans is a centroid-based model: These models are based on algorithms that define a centroid for each cluster, which is updated constantly by an iterative process. The data points are assigned to the cluster where their proximity to the centroid is minimized.
The final output of the algorithm is each data point linked to the cluster it belongs to and the centroid of that cluster, which can be used to label new data in the same clusters.
Importing libraries and packages#
 1# Mathematical operations and data manipulation
 2import pandas as pd
 3import numpy as np
 4
 5# Model
 6from sklearn.cluster import KMeans
 7from sklearn.metrics import silhouette_score
 8from sklearn.metrics import calinski_harabasz_score
 9
10# Plotting
11import matplotlib.pyplot as plt
12
13# Warnings
14import warnings
15
16warnings.filterwarnings("ignore")
17
18%matplotlib inline
Set paths#
1# Path to datasets directory
2data_path = "./datasets"
3# Path to assets directory (for saving results to)
4assets_path = "./assets"
Loading dataset#
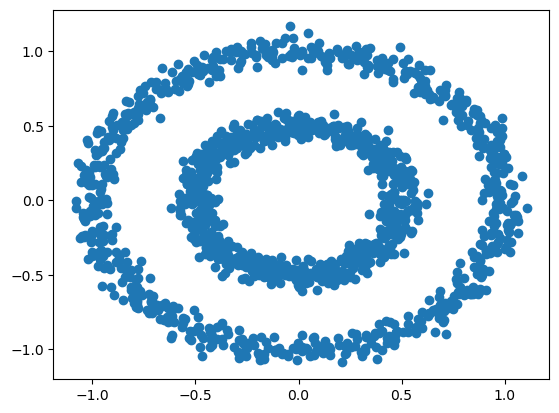
1dataset = pd.read_csv(f"{data_path}/circles.csv")
Exploring dataset#
1# Shape of the dataset
2print("Shape of the dataset: ", dataset.shape)
3# Head
4dataset
Shape of the dataset: (1500, 2)
| 0 | 1 | |
|---|---|---|
| 0 | 0.393992 | -0.416376 |
| 1 | 0.528243 | -0.828242 |
| 2 | -0.740158 | 0.607730 |
| 3 | -0.971016 | 0.316821 |
| 4 | 0.018693 | -0.605288 |
| ... | ... | ... |
| 1495 | 0.085197 | -0.463028 |
| 1496 | 0.890820 | 0.003483 |
| 1497 | 0.223768 | -0.419122 |
| 1498 | 0.221189 | -0.510314 |
| 1499 | 0.544376 | 0.049358 |
1500 rows × 2 columns
1plt.scatter(dataset.iloc[:, 0], dataset.iloc[:, 1])
2plt.show()
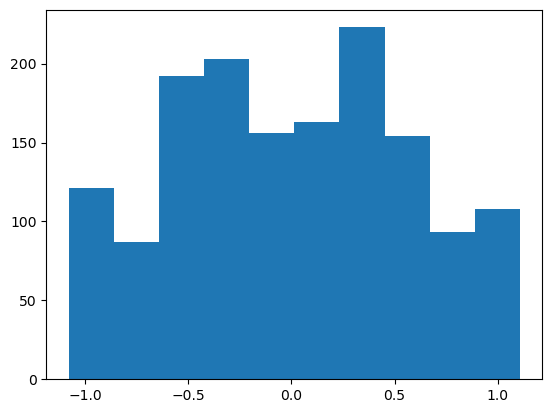
1# Using slicing to select the feature
2plt.hist(dataset.iloc[:, 0])
3plt.show()
KMeans#
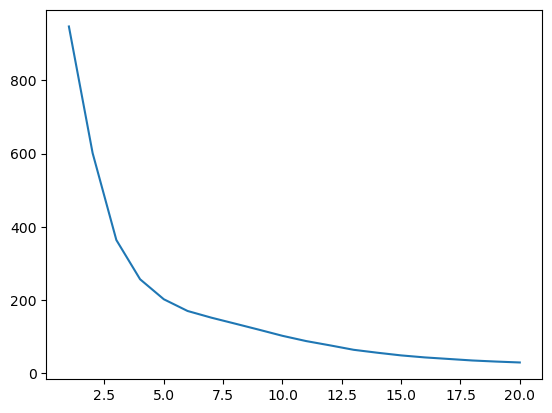
 1# To choose the value for K (the ideal number of clusters), calculate
 2# the average distance of data points from their cluster centroid in
 3# relation to the number of clusters. Using 20 as the maximum number
 4# of clusters.
 5ideal_k = []
 6for i in range(1, 21):
 7    # The random_state argument is used to ensure reproducibility of
 8    # results
 9    est_kmeans = KMeans(n_clusters=i, random_state=0)
10    est_kmeans.fit(dataset)
11    # Append the pairs of data (number of clusters, average distance
12    # to the centroid) to the list
13    ideal_k.append([i, est_kmeans.inertia_])
14
15ideal_k = np.array(ideal_k)
1plt.plot(ideal_k[:, 0], ideal_k[:, 1])
2plt.show()
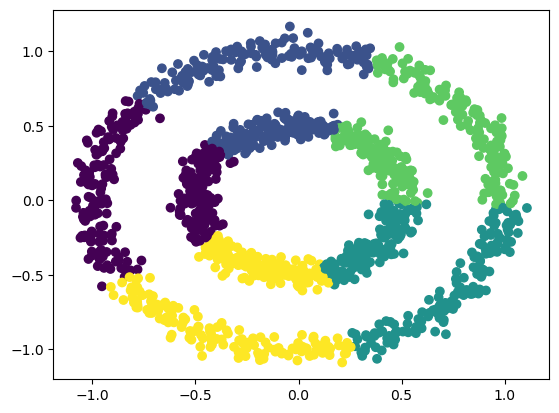
1est_kmeans = KMeans(n_clusters=5, random_state=0)
2est_kmeans.fit(dataset)
3pred_kmeans = est_kmeans.predict(dataset)
1plt.scatter(dataset.iloc[:, 0], dataset.iloc[:, 1], c=pred_kmeans)
2plt.savefig(f"{assets_path}/circles-k-means.png", bbox_inches="tight")
3plt.show()
Metrics#
1# Silhouette
2kmeans_silhouette_score = silhouette_score(
3    dataset, pred_kmeans, metric="euclidean"
4)
5print(kmeans_silhouette_score)
0.35944240125748783
1# Calinski_harabasz
2kmeans_calinski_harabasz_score = calinski_harabasz_score(dataset, pred_kmeans)
3print(kmeans_calinski_harabasz_score)
1379.6867334360659