Flight details
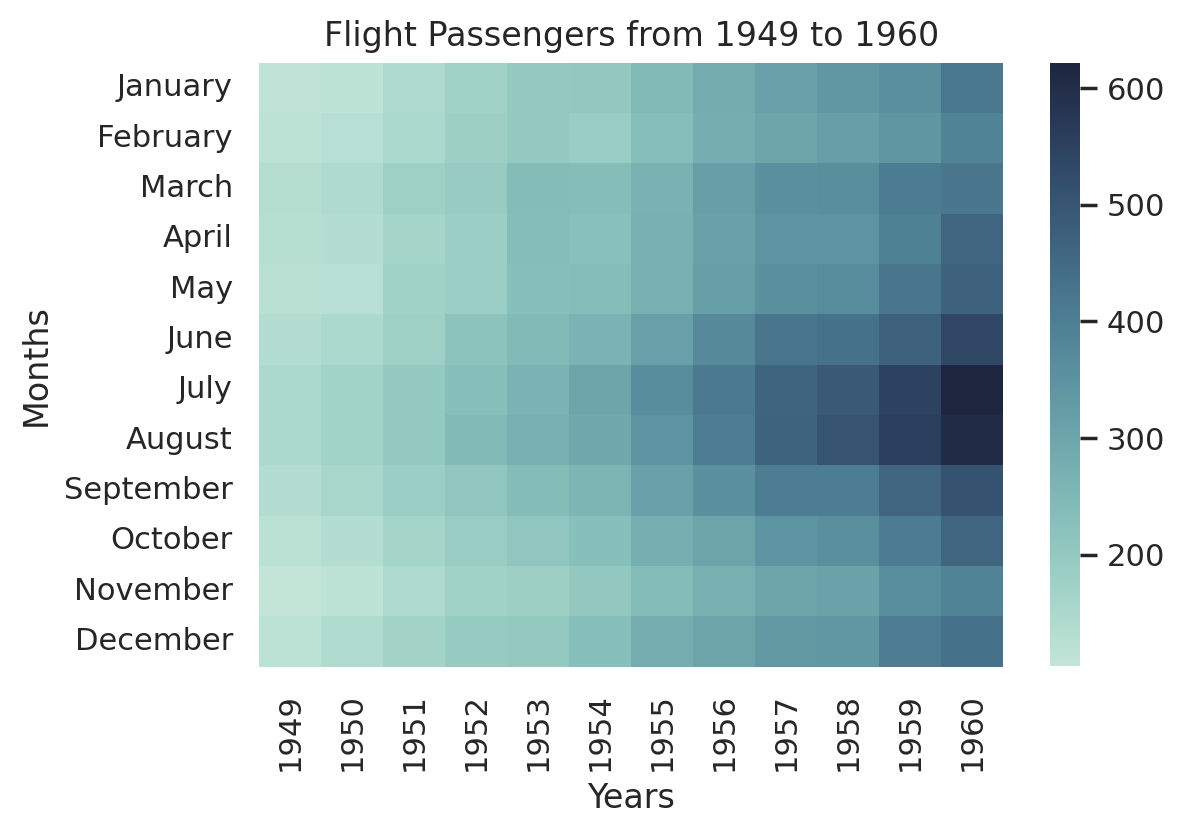
Using a heatmap to find patterns in flight passengers’ data.
Importing libraries and packages
Exploring dataset
Shape of the dataset: (144, 3)
|
Years |
Months |
Passengers |
| 0 |
1949 |
January |
112 |
| 1 |
1949 |
February |
118 |
| 2 |
1949 |
March |
132 |
| 3 |
1949 |
April |
129 |
| 4 |
1949 |
May |
121 |
| ... |
... |
... |
... |
| 139 |
1960 |
August |
606 |
| 140 |
1960 |
September |
508 |
| 141 |
1960 |
October |
461 |
| 142 |
1960 |
November |
390 |
| 143 |
1960 |
December |
432 |
144 rows × 3 columns
Preprocessing
| Years |
1949 |
1950 |
1951 |
1952 |
1953 |
1954 |
1955 |
1956 |
1957 |
1958 |
1959 |
1960 |
| Months |
|
|
|
|
|
|
|
|
|
|
|
|
| April |
129 |
135 |
163 |
181 |
235 |
227 |
269 |
313 |
348 |
348 |
396 |
461 |
| August |
148 |
170 |
199 |
242 |
272 |
293 |
347 |
405 |
467 |
505 |
559 |
606 |
| December |
118 |
140 |
166 |
194 |
201 |
229 |
278 |
306 |
336 |
337 |
405 |
432 |
| February |
118 |
126 |
150 |
180 |
196 |
188 |
233 |
277 |
301 |
318 |
342 |
391 |
| January |
112 |
115 |
145 |
171 |
196 |
204 |
242 |
284 |
315 |
340 |
360 |
417 |
| July |
148 |
170 |
199 |
230 |
264 |
302 |
364 |
413 |
465 |
491 |
548 |
622 |
| June |
135 |
149 |
178 |
218 |
243 |
264 |
315 |
374 |
422 |
435 |
472 |
535 |
| March |
132 |
141 |
178 |
193 |
236 |
235 |
267 |
317 |
356 |
362 |
406 |
419 |
| May |
121 |
125 |
172 |
183 |
229 |
234 |
270 |
318 |
355 |
363 |
420 |
472 |
| November |
104 |
114 |
146 |
172 |
180 |
203 |
237 |
271 |
305 |
310 |
362 |
390 |
| October |
119 |
133 |
162 |
191 |
211 |
229 |
274 |
306 |
347 |
359 |
407 |
461 |
| September |
136 |
158 |
184 |
209 |
237 |
259 |
312 |
355 |
404 |
404 |
463 |
508 |
| Years |
1949 |
1950 |
1951 |
1952 |
1953 |
1954 |
1955 |
1956 |
1957 |
1958 |
1959 |
1960 |
| Months |
|
|
|
|
|
|
|
|
|
|
|
|
| January |
112 |
115 |
145 |
171 |
196 |
204 |
242 |
284 |
315 |
340 |
360 |
417 |
| February |
118 |
126 |
150 |
180 |
196 |
188 |
233 |
277 |
301 |
318 |
342 |
391 |
| March |
132 |
141 |
178 |
193 |
236 |
235 |
267 |
317 |
356 |
362 |
406 |
419 |
| April |
129 |
135 |
163 |
181 |
235 |
227 |
269 |
313 |
348 |
348 |
396 |
461 |
| May |
121 |
125 |
172 |
183 |
229 |
234 |
270 |
318 |
355 |
363 |
420 |
472 |
| June |
135 |
149 |
178 |
218 |
243 |
264 |
315 |
374 |
422 |
435 |
472 |
535 |
| July |
148 |
170 |
199 |
230 |
264 |
302 |
364 |
413 |
465 |
491 |
548 |
622 |
| August |
148 |
170 |
199 |
242 |
272 |
293 |
347 |
405 |
467 |
505 |
559 |
606 |
| September |
136 |
158 |
184 |
209 |
237 |
259 |
312 |
355 |
404 |
404 |
463 |
508 |
| October |
119 |
133 |
162 |
191 |
211 |
229 |
274 |
306 |
347 |
359 |
407 |
461 |
| November |
104 |
114 |
146 |
172 |
180 |
203 |
237 |
271 |
305 |
310 |
362 |
390 |
| December |
118 |
140 |
166 |
194 |
201 |
229 |
278 |
306 |
336 |
337 |
405 |
432 |