

Outliers and missing values#
Importing libraries and packages#
 1# Mathematical operations and data manipulation
 2import pandas as pd
 3
 4# Plotting
 5import seaborn as sns
 6
 7# Warnings
 8import warnings
 9
10warnings.filterwarnings("ignore")
11
12%matplotlib inline
Set paths#
1# Path to datasets directory
2data_path = "./datasets"
3# Path to assets directory (for saving results to)
4assets_path = "./assets"
Loading dataset#
1# load data
2dataset = pd.read_csv(f"{data_path}/preprocessed_airquality.csv")
3dataset.head().T
| 0 | 1 | 2 | 3 | 4 | |
|---|---|---|---|---|---|
| year | 2013 | 2013 | 2013 | 2013 | 2013 |
| month | 3 | 3 | 3 | 3 | 3 |
| day | 1 | 1 | 1 | 1 | 1 |
| hour | 0 | 1 | 2 | 3 | 4 |
| PM25 | 4.0 | 8.0 | 7.0 | 6.0 | 3.0 |
| PM10 | 4.0 | 8.0 | 7.0 | 6.0 | 3.0 |
| SO2 | 4.0 | 4.0 | 5.0 | 11.0 | 12.0 |
| NO2 | 7.0 | 7.0 | 10.0 | 11.0 | 12.0 |
| CO | 300.0 | 300.0 | 300.0 | 300.0 | 300.0 |
| O3 | 77.0 | 77.0 | 73.0 | 72.0 | 72.0 |
| TEMP | -0.7 | -1.1 | -1.1 | -1.4 | -2.0 |
| PRES | 1023.0 | 1023.2 | 1023.5 | 1024.5 | 1025.2 |
| DEWP | -18.8 | -18.2 | -18.2 | -19.4 | -19.5 |
| RAIN | 0.0 | 0.0 | 0.0 | 0.0 | 0.0 |
| wd | NNW | N | NNW | NW | N |
| WSPM | 4.4 | 4.7 | 5.6 | 3.1 | 2.0 |
| station | Aotizhongxin | Aotizhongxin | Aotizhongxin | Aotizhongxin | Aotizhongxin |
Outliers#
1pm_25 = sns.boxplot(dataset["PM25"])
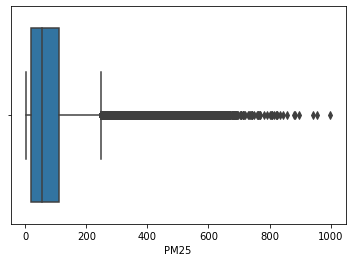
1(dataset["PM25"] >= 250).sum()
18668
1pm25 = dataset.loc[dataset["PM25"] >= 250]
2pm25.head()
| year | month | day | hour | PM25 | PM10 | SO2 | NO2 | CO | O3 | TEMP | PRES | DEWP | RAIN | wd | WSPM | station | |
|---|---|---|---|---|---|---|---|---|---|---|---|---|---|---|---|---|---|
| 120 | 2013 | 3 | 6 | 0 | 284.0 | 315.0 | 133.0 | 174.0 | 4000.0 | 28.0 | 4.9 | 1008.5 | -6.4 | 0.0 | NE | 1.2 | Aotizhongxin |
| 121 | 2013 | 3 | 6 | 1 | 272.0 | 300.0 | 131.0 | 166.0 | 4000.0 | 22.0 | 4.8 | 1008.3 | -5.9 | 0.0 | NE | 1.5 | Aotizhongxin |
| 140 | 2013 | 3 | 6 | 20 | 254.0 | 396.0 | 107.0 | 154.0 | 4200.0 | 17.0 | 4.4 | 1008.2 | -2.5 | 0.0 | SSW | 1.1 | Aotizhongxin |
| 141 | 2013 | 3 | 6 | 21 | 266.0 | 380.0 | 117.0 | 159.0 | 3799.0 | 17.0 | 3.8 | 1007.7 | -2.2 | 0.0 | WSW | 1.9 | Aotizhongxin |
| 142 | 2013 | 3 | 6 | 22 | 254.0 | 335.0 | 111.0 | 148.0 | 4099.0 | 17.0 | 2.4 | 1007.3 | -2.5 | 0.0 | WSW | 1.2 | Aotizhongxin |
1pm_10 = sns.boxplot(dataset.PM10)
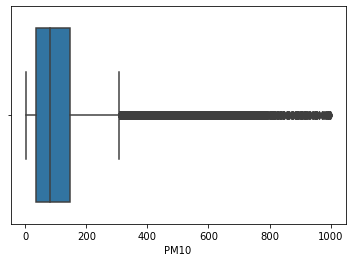
1pm10 = dataset.loc[dataset["PM10"] >= 320]
2pm10.head()
| year | month | day | hour | PM25 | PM10 | SO2 | NO2 | CO | O3 | TEMP | PRES | DEWP | RAIN | wd | WSPM | station | |
|---|---|---|---|---|---|---|---|---|---|---|---|---|---|---|---|---|---|
| 139 | 2013 | 3 | 6 | 19 | 242.0 | 338.0 | 124.0 | 164.0 | 3700.0 | 17.0 | 5.1 | 1007.6 | -2.5 | 0.0 | WSW | 1.2 | Aotizhongxin |
| 140 | 2013 | 3 | 6 | 20 | 254.0 | 396.0 | 107.0 | 154.0 | 4200.0 | 17.0 | 4.4 | 1008.2 | -2.5 | 0.0 | SSW | 1.1 | Aotizhongxin |
| 141 | 2013 | 3 | 6 | 21 | 266.0 | 380.0 | 117.0 | 159.0 | 3799.0 | 17.0 | 3.8 | 1007.7 | -2.2 | 0.0 | WSW | 1.9 | Aotizhongxin |
| 142 | 2013 | 3 | 6 | 22 | 254.0 | 335.0 | 111.0 | 148.0 | 4099.0 | 17.0 | 2.4 | 1007.3 | -2.5 | 0.0 | WSW | 1.2 | Aotizhongxin |
| 143 | 2013 | 3 | 6 | 23 | 260.0 | 360.0 | 119.0 | 145.0 | 4000.0 | 17.0 | 2.3 | 1007.2 | -2.4 | 0.0 | NNE | 1.3 | Aotizhongxin |
1(dataset["PM10"] >= 320).sum()
12865
1dataset.loc[(dataset["PM25"] >= 250) & (dataset["PM10"] >= 320)]
| year | month | day | hour | PM25 | PM10 | SO2 | NO2 | CO | O3 | TEMP | PRES | DEWP | RAIN | wd | WSPM | station | |
|---|---|---|---|---|---|---|---|---|---|---|---|---|---|---|---|---|---|
| 140 | 2013 | 3 | 6 | 20 | 254.0 | 396.0 | 107.0 | 154.0 | 4200.0 | 17.0 | 4.4 | 1008.2 | -2.5 | 0.0 | SSW | 1.1 | Aotizhongxin |
| 141 | 2013 | 3 | 6 | 21 | 266.0 | 380.0 | 117.0 | 159.0 | 3799.0 | 17.0 | 3.8 | 1007.7 | -2.2 | 0.0 | WSW | 1.9 | Aotizhongxin |
| 142 | 2013 | 3 | 6 | 22 | 254.0 | 335.0 | 111.0 | 148.0 | 4099.0 | 17.0 | 2.4 | 1007.3 | -2.5 | 0.0 | WSW | 1.2 | Aotizhongxin |
| 143 | 2013 | 3 | 6 | 23 | 260.0 | 360.0 | 119.0 | 145.0 | 4000.0 | 17.0 | 2.3 | 1007.2 | -2.4 | 0.0 | NNE | 1.3 | Aotizhongxin |
| 149 | 2013 | 3 | 7 | 5 | 275.0 | 337.0 | 46.0 | 103.0 | 5599.0 | 17.0 | 1.6 | 1006.7 | -1.5 | 0.0 | NNE | 1.7 | Aotizhongxin |
| ... | ... | ... | ... | ... | ... | ... | ... | ... | ... | ... | ... | ... | ... | ... | ... | ... | ... |
| 420187 | 2017 | 2 | 4 | 19 | 409.0 | 409.0 | 56.0 | 159.0 | 400.0 | 10.0 | 7.1 | 1013.5 | -8.1 | 0.0 | WNW | 2.4 | Wanshouxigong |
| 420188 | 2017 | 2 | 4 | 20 | 389.0 | 389.0 | 42.0 | 153.0 | 400.0 | 7.0 | 7.7 | 1014.1 | -10.2 | 0.0 | NW | 3.0 | Wanshouxigong |
| 420358 | 2017 | 2 | 11 | 22 | 259.0 | 369.0 | 75.0 | 108.0 | 1500.0 | 76.0 | -1.7 | 1023.6 | -13.9 | 0.0 | ENE | 0.9 | Wanshouxigong |
| 420359 | 2017 | 2 | 11 | 23 | 303.0 | 410.0 | 92.0 | 109.0 | 1700.0 | 2.0 | -1.9 | 1023.5 | -14.0 | 0.0 | N | 0.8 | Wanshouxigong |
| 420360 | 2017 | 2 | 12 | 0 | 350.0 | 388.0 | 96.0 | 106.0 | 2300.0 | 2.0 | -3.2 | 1023.6 | -12.9 | 0.0 | NE | 1.1 | Wanshouxigong |
10047 rows × 17 columns
1((dataset["PM25"] >= 250) & (dataset["PM10"] >= 320)).sum()
10047
1dataset.describe().T
| count | mean | std | min | 25% | 50% | 75% | max | |
|---|---|---|---|---|---|---|---|---|
| year | 420768.0 | 2014.662560 | 1.177198 | 2013.0000 | 2014.00 | 2015.0 | 2016.00 | 2017.0 |
| month | 420768.0 | 6.522930 | 3.448707 | 1.0000 | 4.00 | 7.0 | 10.00 | 12.0 |
| day | 420768.0 | 15.729637 | 8.800102 | 1.0000 | 8.00 | 16.0 | 23.00 | 31.0 |
| hour | 420768.0 | 11.500000 | 6.922195 | 0.0000 | 5.75 | 11.5 | 17.25 | 23.0 |
| PM25 | 412029.0 | 79.793428 | 80.822391 | 2.0000 | 20.00 | 55.0 | 111.00 | 999.0 |
| PM10 | 414319.0 | 104.602618 | 91.772426 | 2.0000 | 36.00 | 82.0 | 145.00 | 999.0 |
| SO2 | 411747.0 | 15.830835 | 21.650603 | 0.2856 | 3.00 | 7.0 | 20.00 | 500.0 |
| NO2 | 408652.0 | 50.638586 | 35.127912 | 1.0265 | 23.00 | 43.0 | 71.00 | 290.0 |
| CO | 400067.0 | 1230.766454 | 1160.182716 | 100.0000 | 500.00 | 900.0 | 1500.00 | 10000.0 |
| O3 | 407491.0 | 57.372271 | 56.661607 | 0.2142 | 11.00 | 45.0 | 82.00 | 1071.0 |
| TEMP | 420370.0 | 13.538976 | 11.436139 | -19.9000 | 3.10 | 14.5 | 23.30 | 41.6 |
| PRES | 420375.0 | 1010.746982 | 10.474055 | 982.4000 | 1002.30 | 1010.4 | 1019.00 | 1042.8 |
| DEWP | 420365.0 | 2.490822 | 13.793847 | -43.4000 | -8.90 | 3.1 | 15.10 | 29.1 |
| RAIN | 420378.0 | 0.064476 | 0.821004 | 0.0000 | 0.00 | 0.0 | 0.00 | 72.5 |
| WSPM | 420450.0 | 1.729711 | 1.246386 | 0.0000 | 0.90 | 1.4 | 2.20 | 13.2 |
1so2 = sns.boxplot(dataset.SO2)
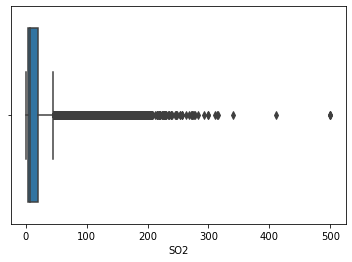
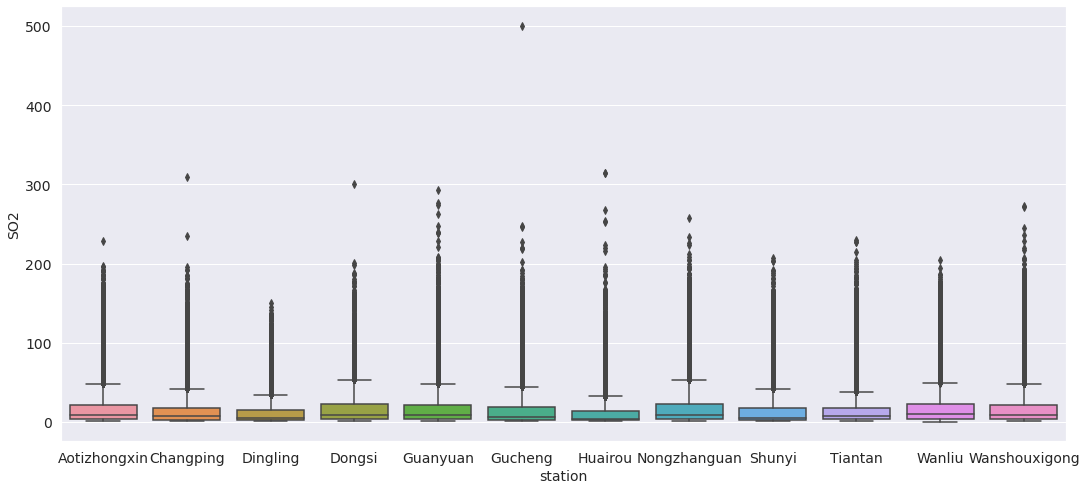
1(dataset["SO2"] >= 70).sum()
14571
1(
2    (dataset["PM25"] >= 250)
3    & (dataset["PM10"] >= 320)
4    & (dataset["SO2"] >= 70)
5).sum()
2297
1(dataset["SO2"] >= 300).sum()
9
1no2 = sns.boxplot(dataset.NO2)
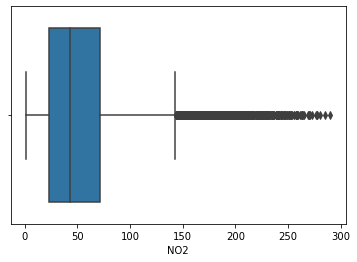
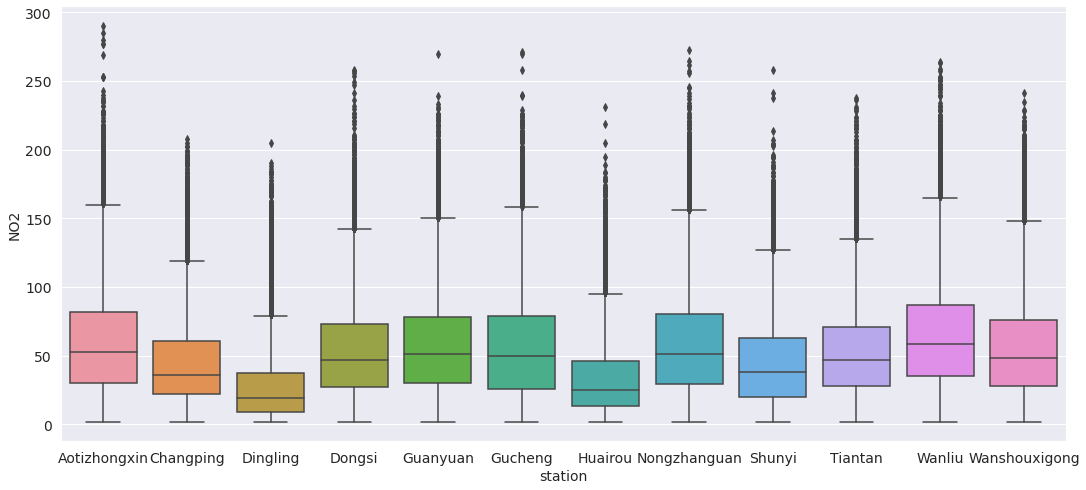
1(dataset["NO2"] >= 150).sum()
5502
1(
2    (dataset["PM25"] >= 250)
3    & (dataset["PM10"] >= 320)
4    & (dataset["SO2"] >= 200)
5    & (dataset["NO2"] >= 150).sum()
6).sum()
0
1co = sns.boxplot(dataset.CO)

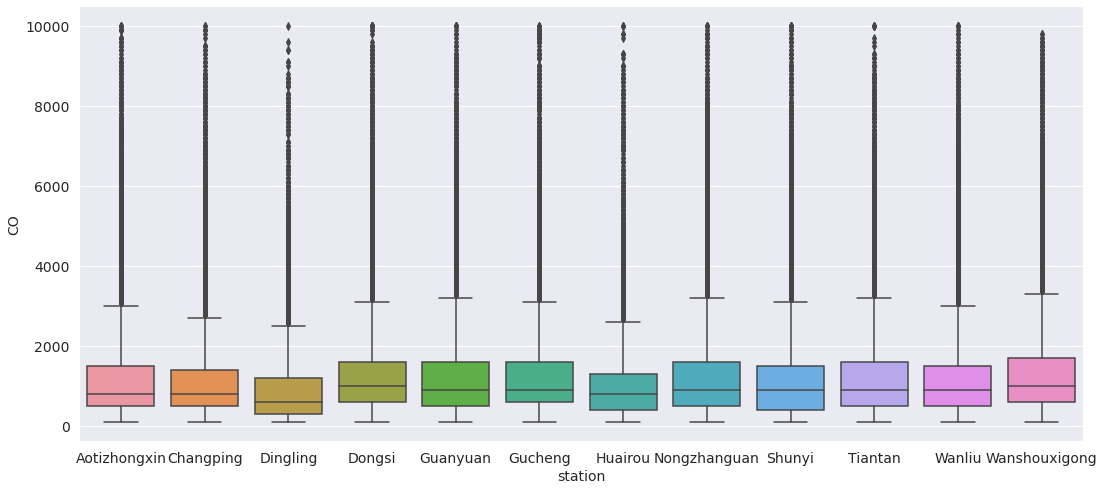
1(dataset["CO"] >= 3000).sum()
30355
1o3 = sns.boxplot(dataset.O3)
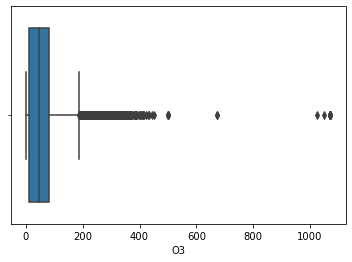
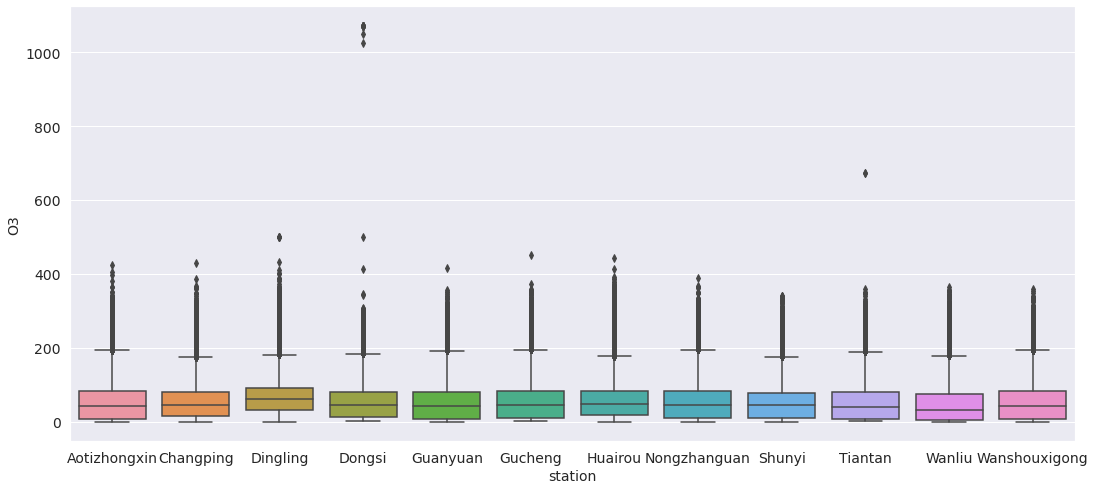
1(dataset["O3"] >= 200).sum()
13358
1(dataset["O3"] >= 470).sum()
24
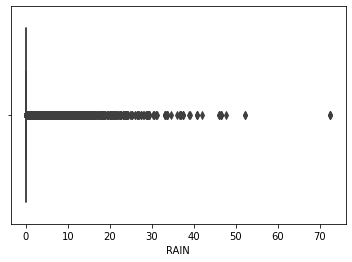
1rain = sns.boxplot(dataset.RAIN)
1colors = ["windows blue", "amber", "faded green", "dusty purple"]
2sns.set(
3 rc={
4 "figure.figsize": (18, 8),
5 # "axes.titlesize" : 18,
6 "axes.labelsize": 14,
7 "xtick.labelsize": 14,
8 "ytick.labelsize": 14,
9 }
10)
11
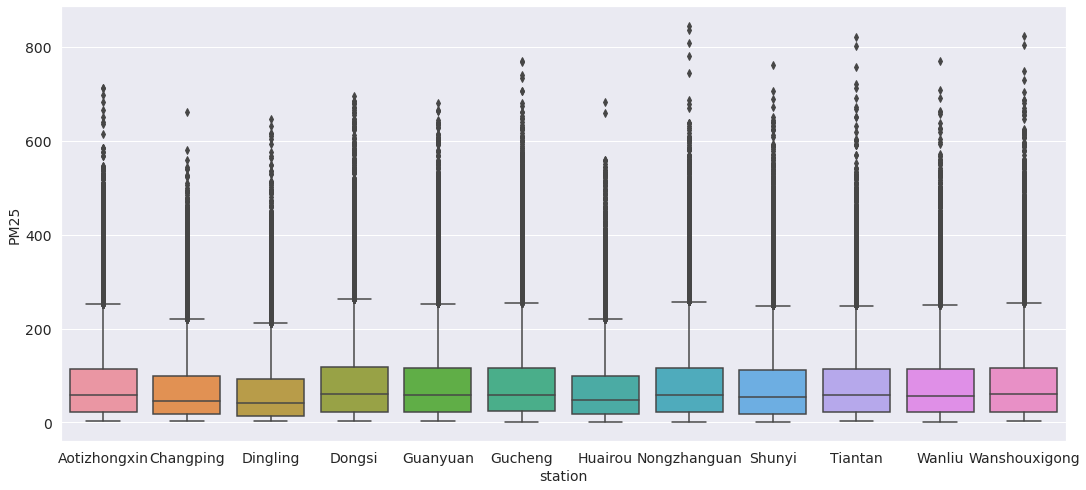
12sns.boxplot(x="station", y="PM25", data=dataset.dropna(axis=0).reset_index())
<AxesSubplot:xlabel='station', ylabel='PM25'>
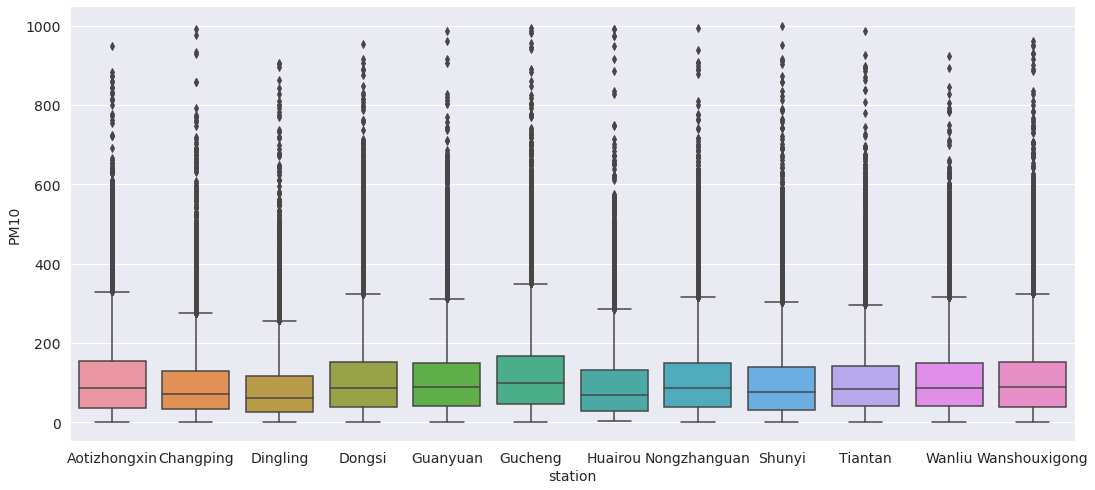
1sns.boxplot(x="station", y="PM10", data=dataset.dropna(axis=0).reset_index())
<AxesSubplot:xlabel='station', ylabel='PM10'>
1sns.boxplot(x="station", y="SO2", data=dataset.dropna(axis=0).reset_index())
<AxesSubplot:xlabel='station', ylabel='SO2'>
1sns.boxplot(x="station", y="NO2", data=dataset.dropna(axis=0).reset_index())
<AxesSubplot:xlabel='station', ylabel='NO2'>
1sns.boxplot(x="station", y="CO", data=dataset.dropna(axis=0).reset_index())
<AxesSubplot:xlabel='station', ylabel='CO'>
1sns.boxplot(x="station", y="O3", data=dataset.dropna(axis=0).reset_index())
<AxesSubplot:xlabel='station', ylabel='O3'>
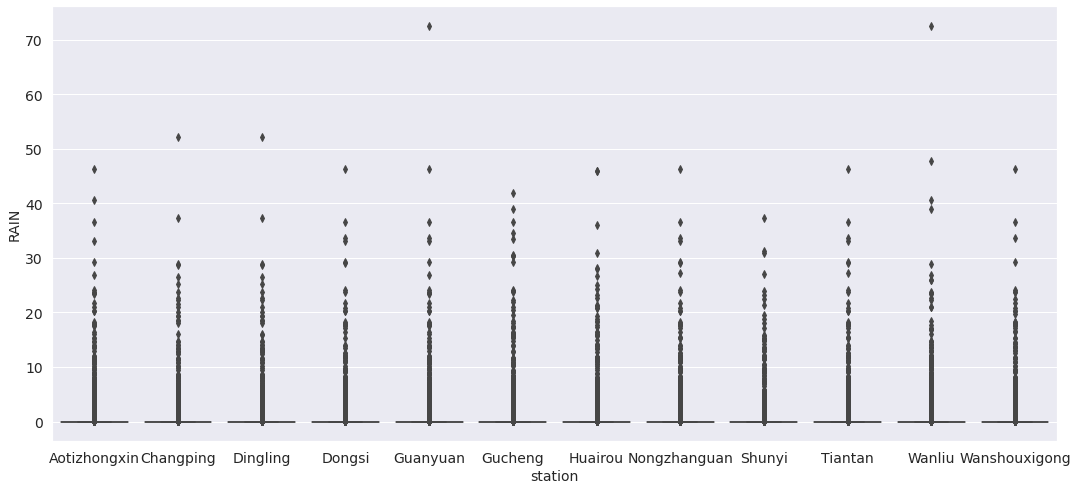
1sns.boxplot(x="station", y="RAIN", data=dataset.dropna(axis=0).reset_index())
<AxesSubplot:xlabel='station', ylabel='RAIN'>
Missing values#
1new_air = dataset
1new_air.isnull().sum()
year           0
month          0
day            0
hour           0
PM25        8739
PM10        6449
SO2         9021
NO2        12116
CO         20701
O3         13277
TEMP         398
PRES         393
DEWP         403
RAIN         390
wd          1822
WSPM         318
station        0
dtype: int64
1new_air["PM25"].fillna(new_air["PM25"].median(), inplace=True)
1new_air.isnull().sum()
year           0
month          0
day            0
hour           0
PM25           0
PM10        6449
SO2         9021
NO2        12116
CO         20701
O3         13277
TEMP         398
PRES         393
DEWP         403
RAIN         390
wd          1822
WSPM         318
station        0
dtype: int64
1new_air = new_air.fillna(new_air["wd"].value_counts().index[0])
1new_air.isnull().sum()
year       0
month      0
day        0
hour       0
PM25       0
PM10       0
SO2        0
NO2        0
CO         0
O3         0
TEMP       0
PRES       0
DEWP       0
RAIN       0
wd         0
WSPM       0
station    0
dtype: int64
1new_air.to_csv(f"{data_path}/cleaned_airquality.csv", index=False)