

Feature selection#
Importing libraries and packages#
 1# Warnings
 2import warnings
 3
 4# Mathematical operations and data manipulation
 5import numpy as np
 6import pandas as pd
 7import missingno as msno
 8from sklearn.impute import SimpleImputer
 9
10# https://scikit-learn.org/stable/modules/generated/sklearn.impute.IterativeImputer.html
11from sklearn.experimental import enable_iterative_imputer  # noqa
12
13# Didn't work, so I added IterativeImputer to the _all_ list in
14# sklearn impute by hand
15from sklearn.impute import IterativeImputer
16from sklearn.linear_model import Lasso
17
18# For loading .arff files
19from scipy.io import arff
20
21warnings.filterwarnings("ignore")
22warnings.filterwarnings("ignore", category=DeprecationWarning)
23%matplotlib inline
Set paths#
1# Path to datasets directory
2data_path = "./datasets"
3# Path to assets directory (for saving results to)
4assets_path = "./assets"
Loading dataset#
 1# Loading the 5 raw .arff files into a list
 2def load_arff_raw_data():
 3    n = 5
 4    return [
 5        arff.loadarff(f"{data_path}/" + str(i + 1) + "year.arff")
 6        for i in range(n)
 7    ]
 8
 9
10# Loading the 5 raw .arff files into pandas dataframes
11def load_dataframes():
12    return [
13        pd.DataFrame(data_i_year[0]) for data_i_year in load_arff_raw_data()
14    ]
15
16
17# Setting column headers from X1 ... X64 and the class label as Y,
18# for all the 5 dataframes.
19def set_new_headers(dataframes):
20    cols = ["X" + str(i + 1) for i in range(len(dataframes[0].columns) - 1)]
21    cols.append("Y")
22    for df in dataframes:
23        df.columns = cols
24
25
26# dataframes is the list of pandas dataframes for the 5 year datafiles.
27dfs = load_dataframes()
28
29# Set new headers for the dataframes: the renamed set of feature (X1 to X64)
30set_new_headers(dfs)
31
32# print the first 5 rows of a dataset 'year1'
33dfs[0].head()
| X1 | X2 | X3 | X4 | X5 | X6 | X7 | X8 | X9 | X10 | ... | X56 | X57 | X58 | X59 | X60 | X61 | X62 | X63 | X64 | Y | |
|---|---|---|---|---|---|---|---|---|---|---|---|---|---|---|---|---|---|---|---|---|---|
| 0 | 0.200550 | 0.37951 | 0.39641 | 2.0472 | 32.3510 | 0.38825 | 0.249760 | 1.33050 | 1.1389 | 0.50494 | ... | 0.121960 | 0.39718 | 0.87804 | 0.001924 | 8.4160 | 5.1372 | 82.658 | 4.4158 | 7.4277 | b'0' |
| 1 | 0.209120 | 0.49988 | 0.47225 | 1.9447 | 14.7860 | 0.00000 | 0.258340 | 0.99601 | 1.6996 | 0.49788 | ... | 0.121300 | 0.42002 | 0.85300 | 0.000000 | 4.1486 | 3.2732 | 107.350 | 3.4000 | 60.9870 | b'0' |
| 2 | 0.248660 | 0.69592 | 0.26713 | 1.5548 | -1.1523 | 0.00000 | 0.309060 | 0.43695 | 1.3090 | 0.30408 | ... | 0.241140 | 0.81774 | 0.76599 | 0.694840 | 4.9909 | 3.9510 | 134.270 | 2.7185 | 5.2078 | b'0' |
| 3 | 0.081483 | 0.30734 | 0.45879 | 2.4928 | 51.9520 | 0.14988 | 0.092704 | 1.86610 | 1.0571 | 0.57353 | ... | 0.054015 | 0.14207 | 0.94598 | 0.000000 | 4.5746 | 3.6147 | 86.435 | 4.2228 | 5.5497 | b'0' |
| 4 | 0.187320 | 0.61323 | 0.22960 | 1.4063 | -7.3128 | 0.18732 | 0.187320 | 0.63070 | 1.1559 | 0.38677 | ... | 0.134850 | 0.48431 | 0.86515 | 0.124440 | 6.3985 | 4.3158 | 127.210 | 2.8692 | 7.8980 | b'0' |
5 rows × 65 columns
1dfs[0].shape
(7027, 65)
 1# Converting dtypes of all the columns (other than the class
 2# label columns) to float.
 3def convert_columns_type_float(dataframes):
 4    for i in range(5):
 5        index = 1
 6        while index <= 63:
 7            colname = dfs[i].columns[index]
 8            col = getattr(dfs[i], colname)
 9            dataframes[i][colname] = col.astype(float)
10            index += 1
11
12
13convert_columns_type_float(dfs)
1# The class labels for all the dataframes are originally in object type.
2# Converting to int types
3def convert_class_label_type_int(dataframes):
4    for i in range(len(dataframes)):
5        col = getattr(dfs[i], "Y")
6        dataframes[i]["Y"] = col.astype(int)
7
8
9convert_class_label_type_int(dfs)
1# Shape of the year1 DataFrame
2dfs[0].head()
| X1 | X2 | X3 | X4 | X5 | X6 | X7 | X8 | X9 | X10 | ... | X56 | X57 | X58 | X59 | X60 | X61 | X62 | X63 | X64 | Y | |
|---|---|---|---|---|---|---|---|---|---|---|---|---|---|---|---|---|---|---|---|---|---|
| 0 | 0.200550 | 0.37951 | 0.39641 | 2.0472 | 32.3510 | 0.38825 | 0.249760 | 1.33050 | 1.1389 | 0.50494 | ... | 0.121960 | 0.39718 | 0.87804 | 0.001924 | 8.4160 | 5.1372 | 82.658 | 4.4158 | 7.4277 | 0 |
| 1 | 0.209120 | 0.49988 | 0.47225 | 1.9447 | 14.7860 | 0.00000 | 0.258340 | 0.99601 | 1.6996 | 0.49788 | ... | 0.121300 | 0.42002 | 0.85300 | 0.000000 | 4.1486 | 3.2732 | 107.350 | 3.4000 | 60.9870 | 0 |
| 2 | 0.248660 | 0.69592 | 0.26713 | 1.5548 | -1.1523 | 0.00000 | 0.309060 | 0.43695 | 1.3090 | 0.30408 | ... | 0.241140 | 0.81774 | 0.76599 | 0.694840 | 4.9909 | 3.9510 | 134.270 | 2.7185 | 5.2078 | 0 |
| 3 | 0.081483 | 0.30734 | 0.45879 | 2.4928 | 51.9520 | 0.14988 | 0.092704 | 1.86610 | 1.0571 | 0.57353 | ... | 0.054015 | 0.14207 | 0.94598 | 0.000000 | 4.5746 | 3.6147 | 86.435 | 4.2228 | 5.5497 | 0 |
| 4 | 0.187320 | 0.61323 | 0.22960 | 1.4063 | -7.3128 | 0.18732 | 0.187320 | 0.63070 | 1.1559 | 0.38677 | ... | 0.134850 | 0.48431 | 0.86515 | 0.124440 | 6.3985 | 4.3158 | 127.210 | 2.8692 | 7.8980 | 0 |
5 rows × 65 columns
X1 net profit / total assets X2 total liabilities / total assets X3 working capital / total assets X4 current assets / short-term liabilities X5 ((cash + short-term securities + receivables - short-term liabilities) / (operating expenses - depreciation)) * 365 X6 retained earnings / total assets X7 EBIT / total assets X8 book value of equity / total liabilities X9 sales / total assets X10 equity / total assets X11 (gross profit + extraordinary items + financial expenses) / total assets X12 gross profit / short-term liabilities X13 (gross profit + depreciation) / sales X14 (gross profit + interest) / total assets X15 (total liabilities * 365) / (gross profit + depreciation) X16 (gross profit + depreciation) / total liabilities X17 total assets / total liabilities X18 gross profit / total assets X19 gross profit / sales X20 (inventory * 365) / sales X21 sales (n) / sales (n-1) X22 profit on operating activities / total assets X23 net profit / sales X24 gross profit (in 3 years) / total assets X25 (equity - share capital) / total assets X26 (net profit + depreciation) / total liabilities X27 profit on operating activities / financial expenses X28 working capital / fixed assets X29 logarithm of total assets X30 (total liabilities - cash) / sales X31 (gross profit + interest) / sales X32 (current liabilities * 365) / cost of products sold X33 operating expenses / short-term liabilities X34 operating expenses / total liabilities X35 profit on sales / total assets X36 total sales / total assets X37 (current assets - inventories) / long-term liabilities X38 constant capital / total assets X39 profit on sales / sales X40 (current assets - inventory - receivables) / short-term liabilities X41 total liabilities / ((profit on operating activities + depreciation) * (12/365)) X42 profit on operating activities / sales X43 rotation receivables + inventory turnover in days X44 (receivables * 365) / sales X45 net profit / inventory X46 (current assets - inventory) / short-term liabilities X47 (inventory * 365) / cost of products sold X48 EBITDA (profit on operating activities - depreciation) / total assets X49 EBITDA (profit on operating activities - depreciation) / sales X50 current assets / total liabilities X51 short-term liabilities / total assets X52 (short-term liabilities * 365) / cost of products sold) X53 equity / fixed assets X54 constant capital / fixed assets X55 working capital X56 (sales - cost of products sold) / sales X57 (current assets - inventory - short-term liabilities) / (sales - gross profit - depreciation) X58 total costs /total sales X59 long-term liabilities / equity X60 sales / inventory X61 sales / receivables X62 (short-term liabilities *365) / sales X63 sales / short-term liabilities X64 sales / fixed assets
Missing Value Analysis for the DataFrames#
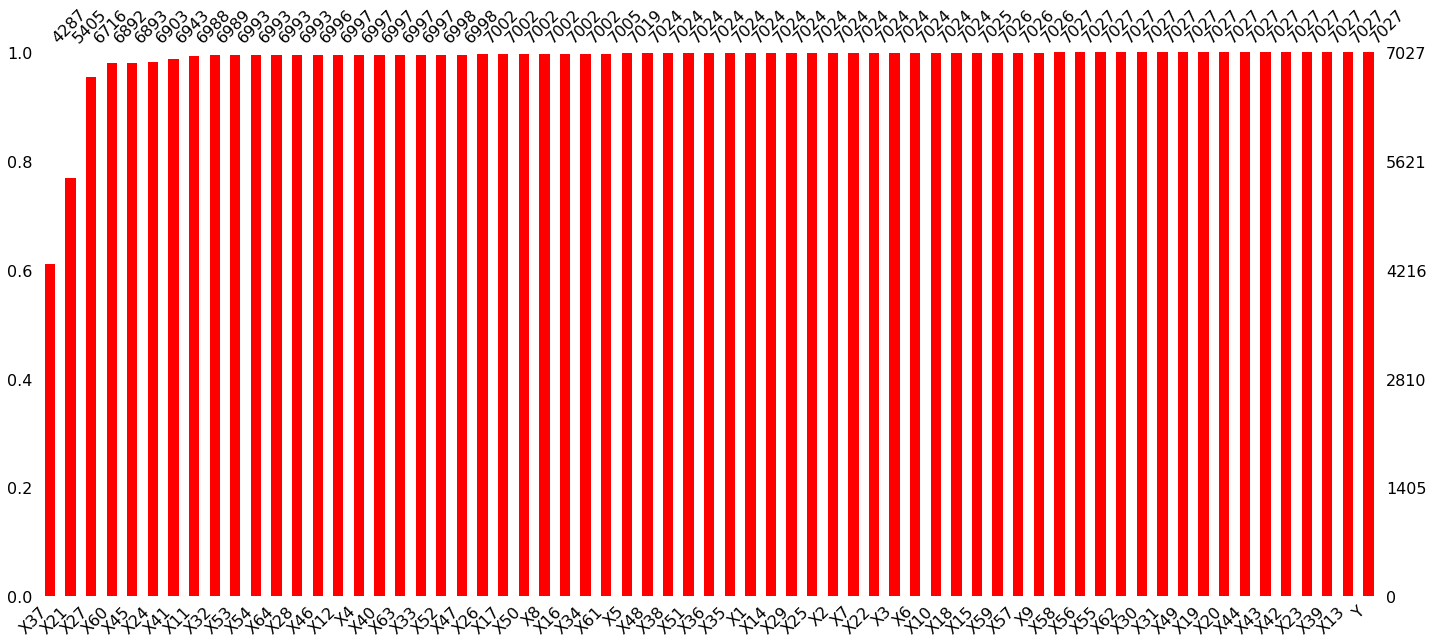
1# Missing Values in the first Dataframe
2msno.bar(dfs[0], color="red", labels=True, sort="ascending")
<AxesSubplot:>
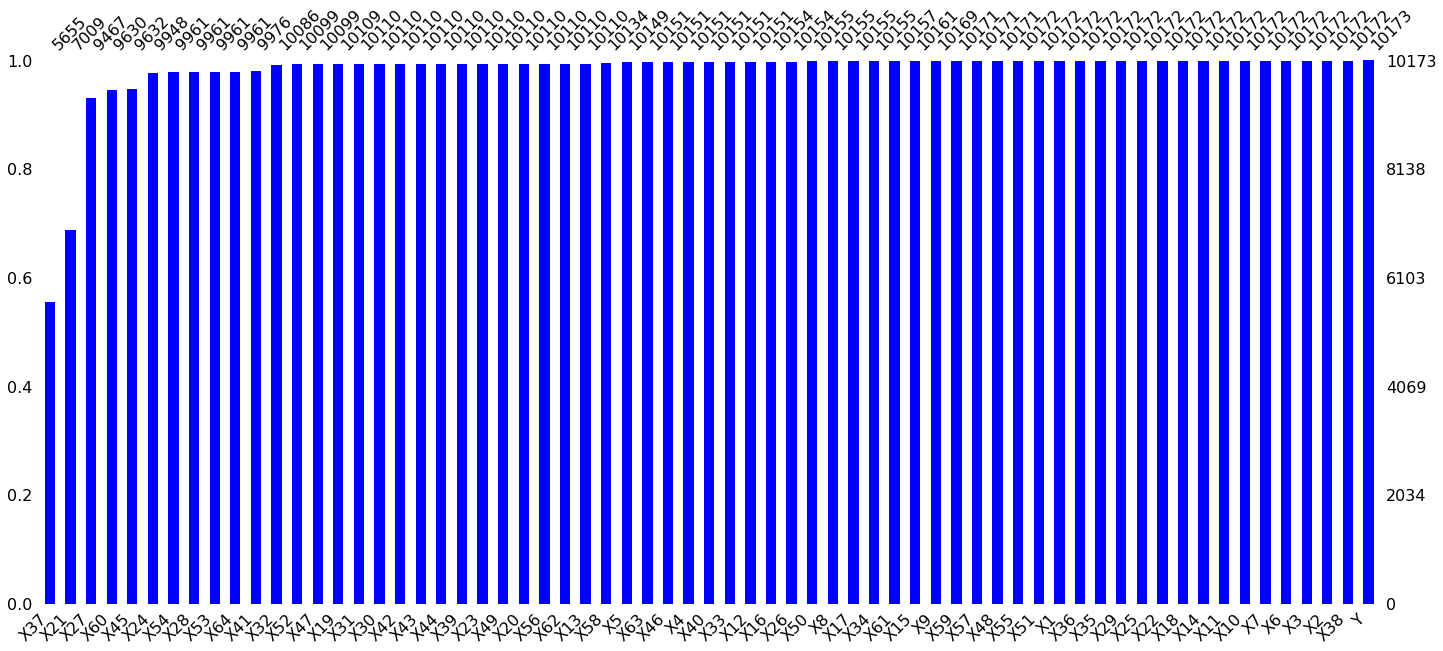
1# Missing Values in the second Dataframe
2msno.bar(dfs[1], color="blue", labels=True, sort="ascending")
<AxesSubplot:>
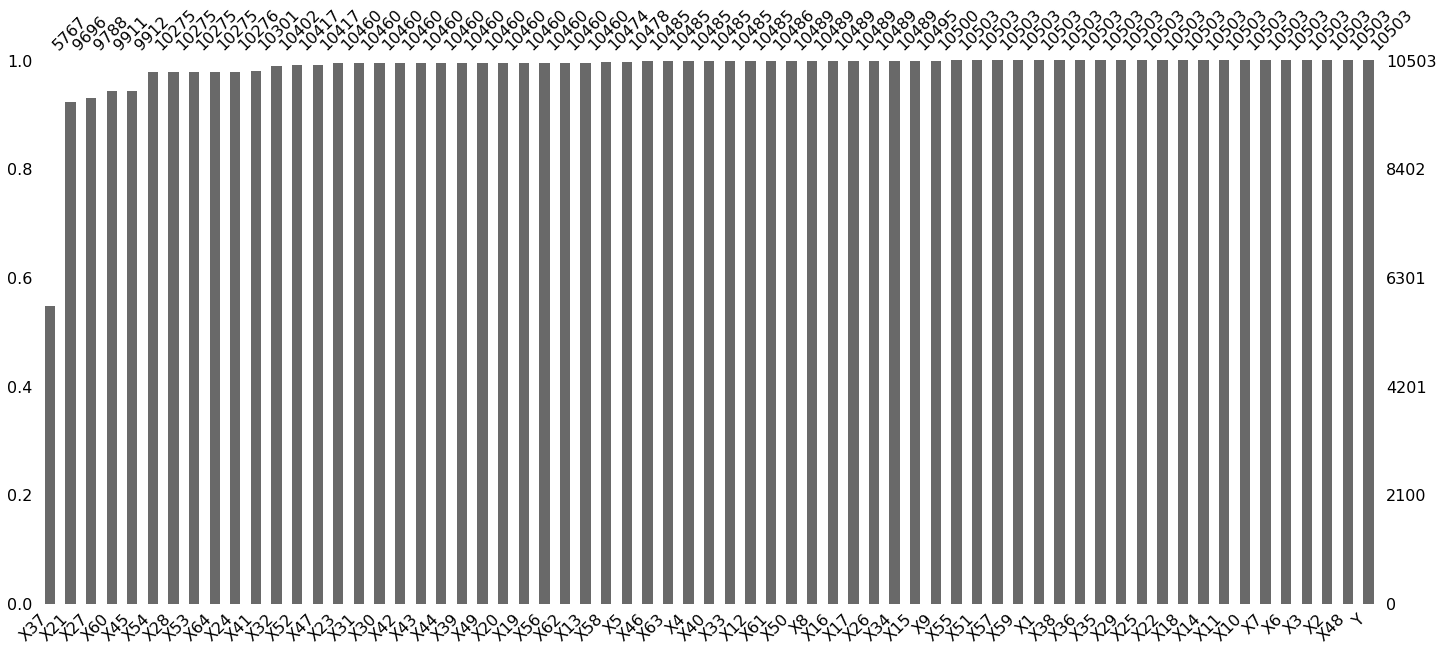
1# Missing Values in the third Dataframe
2msno.bar(dfs[2], labels=True, sort="ascending")
<AxesSubplot:>
Mean Imputation on the DataFrames#
1imputer = SimpleImputer(missing_values=np.nan, strategy="mean")
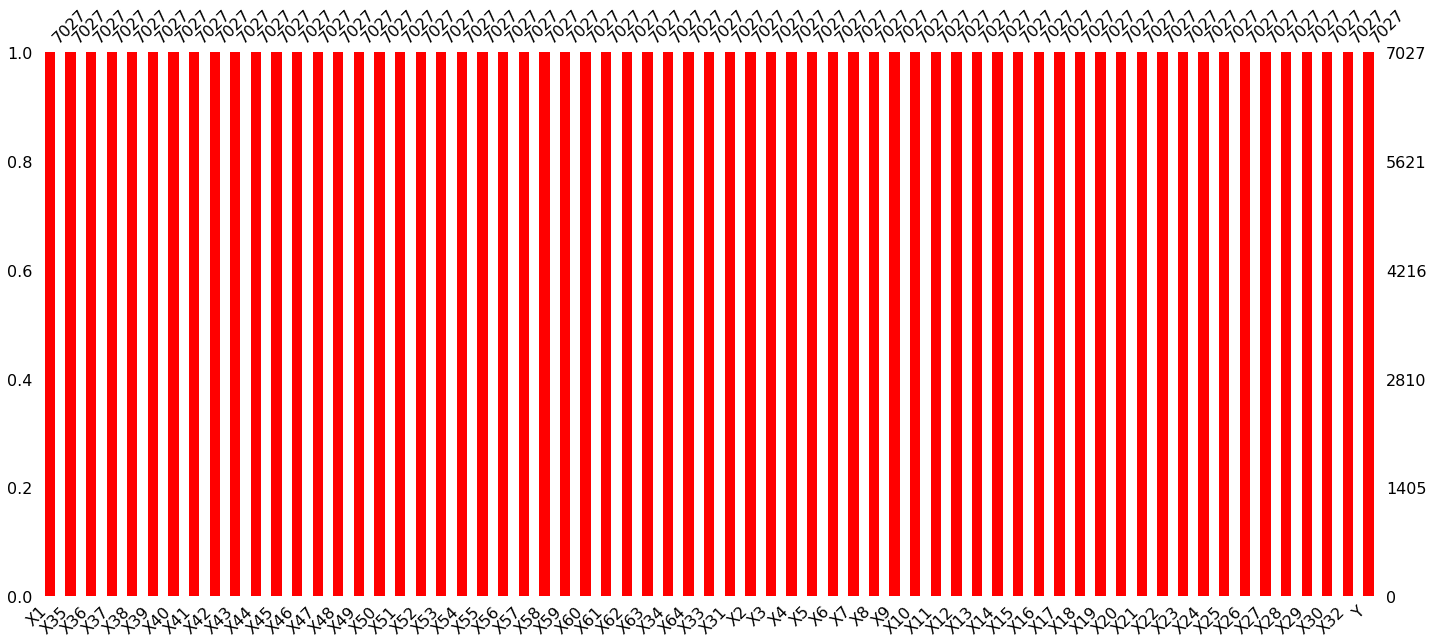
1# Imputation for the first Dataframe
2mean_imputed_df1 = pd.DataFrame(
3 imputer.fit_transform(dfs[0]), columns=dfs[0].columns
4)
5
6# Checking for missing values
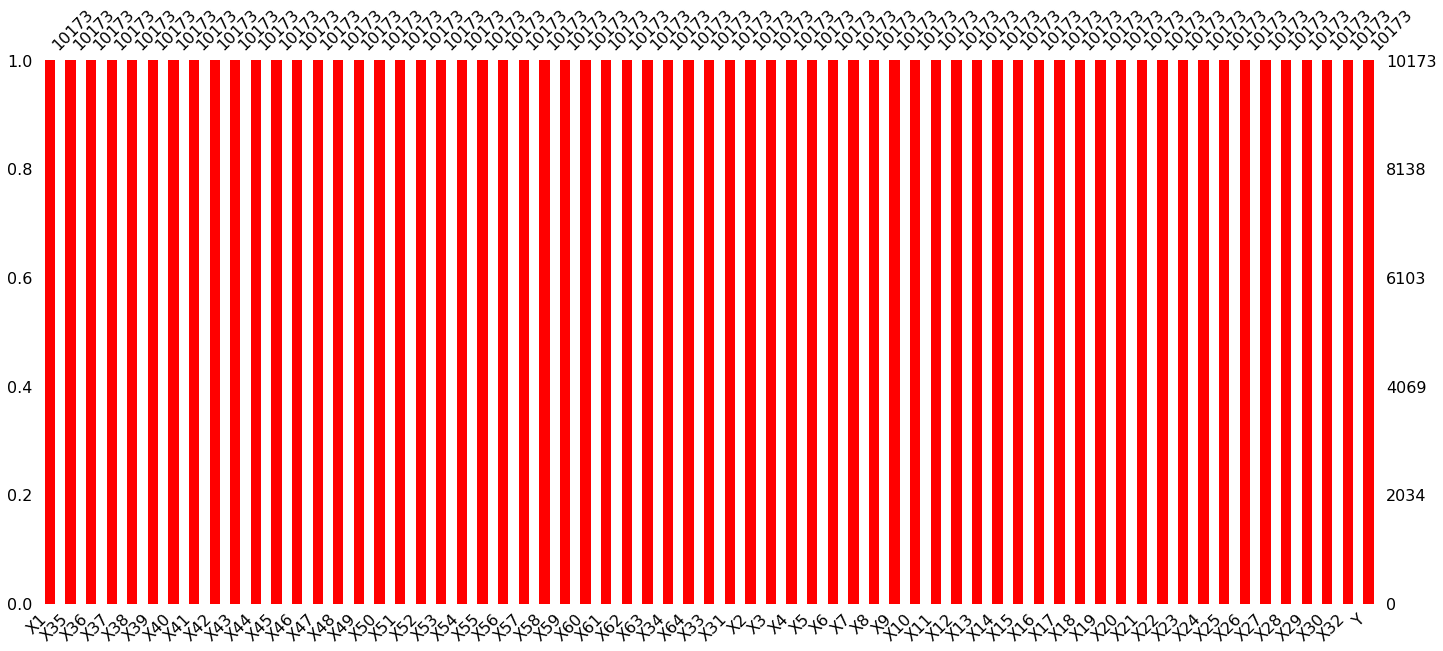
7msno.bar(mean_imputed_df1, color="red", labels=True, sort="ascending")
<AxesSubplot:>
1# Imputation for the second Dataframe
2mean_imputed_df2 = pd.DataFrame(
3    imputer.fit_transform(dfs[1]), columns=dfs[1].columns
4)
5
6# Checking for missing values
7msno.bar(mean_imputed_df2, color="red", labels=True, sort="ascending")
<AxesSubplot:>
1# Imputation for the third  Dataframe
2mean_imputed_df3 = pd.DataFrame(
3    imputer.fit_transform(dfs[2]), columns=dfs[2].columns
4)
5
6# Checking missing values
7msno.bar(mean_imputed_df3, color="red", labels=True, sort="ascending")
<AxesSubplot:>

1# Imputation for the fourth Dataframe
2mean_imputed_df4 = pd.DataFrame(
3    imputer.fit_transform(dfs[3]), columns=dfs[3].columns
4)
5# Imputation for the fifth Dataframe
6mean_imputed_df5 = pd.DataFrame(
7    imputer.fit_transform(dfs[4]), columns=dfs[4].columns
8)
Iterative Imputation on the DataFrames#
1imputer = IterativeImputer()
1# First DataFrame
2iterative_imputed_df1 = pd.DataFrame(
3    imputer.fit_transform(dfs[0]), columns=dfs[0].columns
4)
5
6# Checking missing values
7msno.bar(iterative_imputed_df1, color="red", labels=True, sort="ascending")
<AxesSubplot:>
1# Second DataFrame
2iterative_imputed_df2 = pd.DataFrame(
3    imputer.fit_transform(dfs[1]), columns=dfs[1].columns
4)
5
6# Checking missing values
7msno.bar(iterative_imputed_df2, color="red", labels=True, sort="ascending")
<AxesSubplot:>
Etcetera
 1# Third DataFrame
 2iterative_imputed_df3 = pd.DataFrame(
 3    imputer.fit_transform(dfs[2]), columns=dfs[2].columns
 4)
 5# Fourth DataFrame
 6iterative_imputed_df4 = pd.DataFrame(
 7    imputer.fit_transform(dfs[3]), columns=dfs[3].columns
 8)
 9# Fifth DataFrame
10iterative_imputed_df5 = pd.DataFrame(
11    imputer.fit_transform(dfs[4]), columns=dfs[4].columns
12)
Splitting the features#
 1# First DataFrame
 2X0 = mean_imputed_df1.drop("Y", axis=1)
 3y0 = mean_imputed_df1.Y
 4# Second DataFrame
 5X1 = mean_imputed_df2.drop("Y", axis=1)
 6y1 = mean_imputed_df2.Y
 7# Third DataFrame
 8X2 = mean_imputed_df3.drop("Y", axis=1)
 9y2 = mean_imputed_df3.Y
10X6 = mean_imputed_df4.drop("Y", axis=1)
11y6 = mean_imputed_df4.Y
12X7 = mean_imputed_df5.drop("Y", axis=1)
13y7 = mean_imputed_df5.Y
 1# First DataFrame
 2X3 = iterative_imputed_df1.drop("Y", axis=1)
 3y3 = iterative_imputed_df1.Y
 4# Second DataFrame
 5X4 = iterative_imputed_df2.drop("Y", axis=1)
 6y4 = iterative_imputed_df2.Y
 7# Third DataFrame
 8X5 = iterative_imputed_df3.drop("Y", axis=1)
 9y5 = iterative_imputed_df3.Y
10X8 = iterative_imputed_df4.drop("Y", axis=1)
11y8 = iterative_imputed_df4.Y
12X9 = iterative_imputed_df5.drop("Y", axis=1)
13y9 = iterative_imputed_df5.Y
Feature Selection with Lasso#
1features_names = X6.columns.tolist()
2lasso = Lasso(alpha=0.01, positive=True)
3lasso.fit(X6, y6)
4coef_list = sorted(
5    zip(map(lambda x: round(x, 4), lasso.coef_.reshape(-1)), features_names),
6    reverse=True,
7)
8coef_list[0:5]
[(0.0009, 'X21'), (0.0002, 'X2'), (0.0001, 'X42'), (0.0, 'X9'), (0.0, 'X8')]
1features_names = X7.columns.tolist()
2lasso = Lasso(alpha=0.01, positive=True)
3lasso.fit(X7, y7)
4coef_list = sorted(
5    zip(map(lambda x: round(x, 4), lasso.coef_.reshape(-1)), features_names),
6    reverse=True,
7)
8coef_list[0:10]
[(0.0216, 'X51'),
 (0.0015, 'X2'),
 (0.001, 'X9'),
 (0.001, 'X36'),
 (0.0003, 'X59'),
 (0.0003, 'X52'),
 (0.0001, 'X61'),
 (0.0001, 'X31'),
 (0.0001, 'X30'),
 (0.0001, 'X20')]
1features_names = X8.columns.tolist()
2lasso = Lasso(alpha=0.01, positive=True)
3lasso.fit(X8, y8)
4coef_list = sorted(
5    zip(map(lambda x: round(x, 4), lasso.coef_.reshape(-1)), features_names),
6    reverse=True,
7)
8coef_list[0:5]
[(0.0009, 'X21'), (0.0002, 'X42'), (0.0002, 'X2'), (0.0, 'X9'), (0.0, 'X8')]
1features_names = X9.columns.tolist()
2lasso = Lasso(alpha=0.01, positive=True)
3lasso.fit(X9, y9)
4coef_list = sorted(
5    zip(map(lambda x: round(x, 4), lasso.coef_.reshape(-1)), features_names),
6    reverse=True,
7)
8coef_list[0:10]
[(0.0214, 'X51'),
 (0.0015, 'X2'),
 (0.0012, 'X9'),
 (0.0009, 'X36'),
 (0.0003, 'X59'),
 (0.0003, 'X52'),
 (0.0001, 'X61'),
 (0.0001, 'X31'),
 (0.0001, 'X30'),
 (0.0001, 'X20')]
The significant columns:
X51 : Short-term liabilities/total assets
X2 : Total liabilities/total assets
X9 : Sales/total assets
X36 : Total sales/total assets
X59 : Long-term liabilities/equity
X52 : (short-term liabilities * 365)/cost of products sold
X61 : Sales/receivables
X31 : (gross profit + interest)/sales
X30 : (total liabilities - cash)/sales
X20 : (inventory * 365)/sales