Outliers#
Importing libraries and packages#
 1# Mathematical operations and data manipulation
 2import pandas as pd
 3
 4# Visualisation
 5import seaborn as sns
 6import matplotlib.pyplot as plt
 7
 8# Warnings
 9import warnings
10
11warnings.filterwarnings("ignore")
12
13%matplotlib inline
Set paths#
1# Path to datasets directory
2data_path = "./datasets"
3# Path to assets directory (for saving results to)
4assets_path = "./assets"
Loading dataset#
1# load data
2dataset = pd.read_csv(f"{data_path}/preprocessed_heart.csv")
3dataset.head().T
| 0 | 1 | 2 | 3 | 4 | |
|---|---|---|---|---|---|
| age | 63.0 | 37.0 | 41.0 | 56.0 | 57.0 |
| sex | 1.0 | 1.0 | 0.0 | 1.0 | 0.0 |
| chest_pain | 3.0 | 2.0 | 1.0 | 1.0 | 0.0 |
| rest_bp | 145.0 | 130.0 | 130.0 | 120.0 | 120.0 |
| chol | 233.0 | 250.0 | 204.0 | 236.0 | 354.0 |
| fast_bld_sugar | 1.0 | 0.0 | 0.0 | 0.0 | 0.0 |
| rest_ecg | 0.0 | 1.0 | 0.0 | 1.0 | 1.0 |
| max_hr | 150.0 | 187.0 | 172.0 | 178.0 | 163.0 |
| ex_angina | 0.0 | 0.0 | 0.0 | 0.0 | 1.0 |
| st_depr | 2.3 | 3.5 | 1.4 | 0.8 | 0.6 |
| slope | 0.0 | 0.0 | 2.0 | 2.0 | 2.0 |
| colored_vessels | 0.0 | 0.0 | 0.0 | 0.0 | 0.0 |
| thalassemia | 1.0 | 2.0 | 2.0 | 2.0 | 2.0 |
| target | 1.0 | 1.0 | 1.0 | 1.0 | 1.0 |
Checking for Outliers#
1sns.set(
2 palette="pastel",
3 rc={
4 "figure.figsize": (12, 8),
5 "axes.titlesize": 18,
6 "axes.labelsize": 16,
7 "xtick.labelsize": 16,
8 "ytick.labelsize": 16,
9 },
10)
11
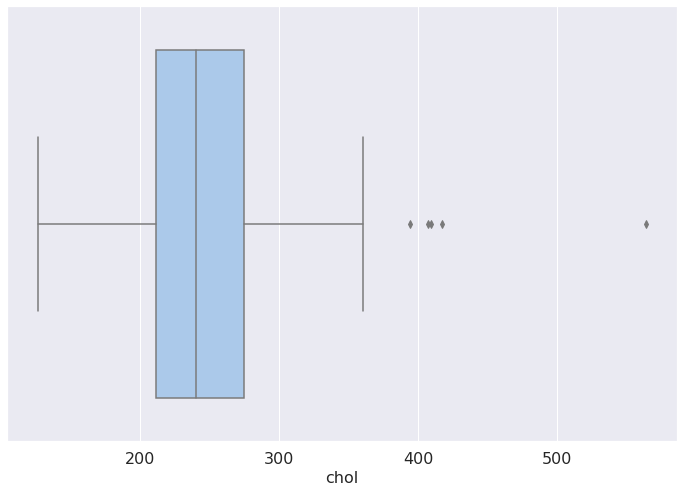
12chol = sns.boxplot(dataset["chol"])
13plt.show()
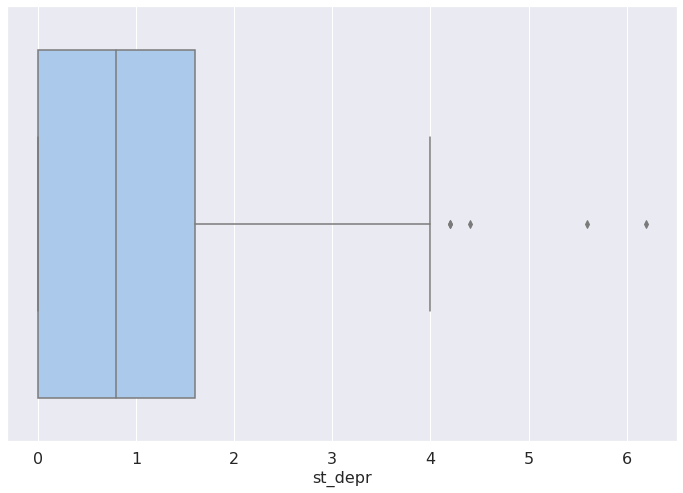
1sd = sns.boxplot(dataset["st_depr"])
2plt.show()
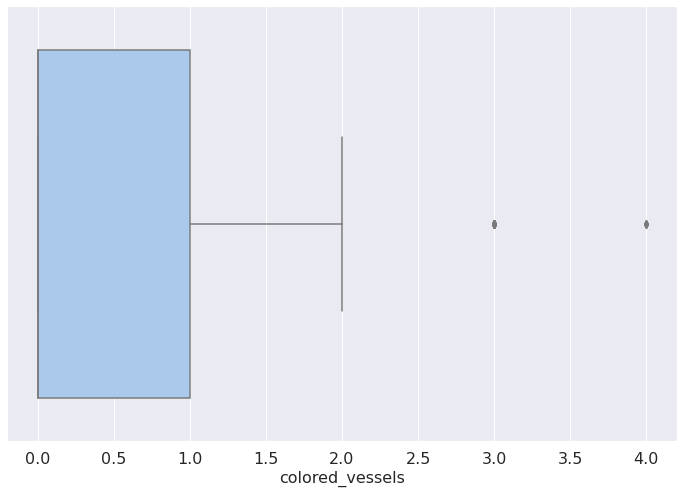
1cv = sns.boxplot(dataset["colored_vessels"])
2plt.show()
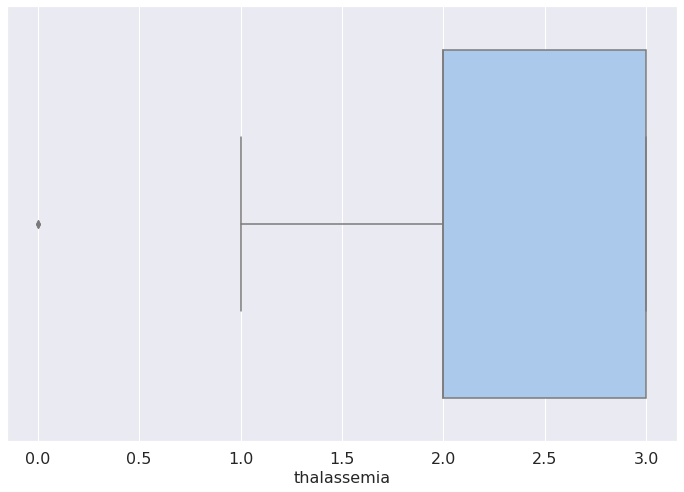
1t = sns.boxplot(dataset["thalassemia"])
2plt.show()